
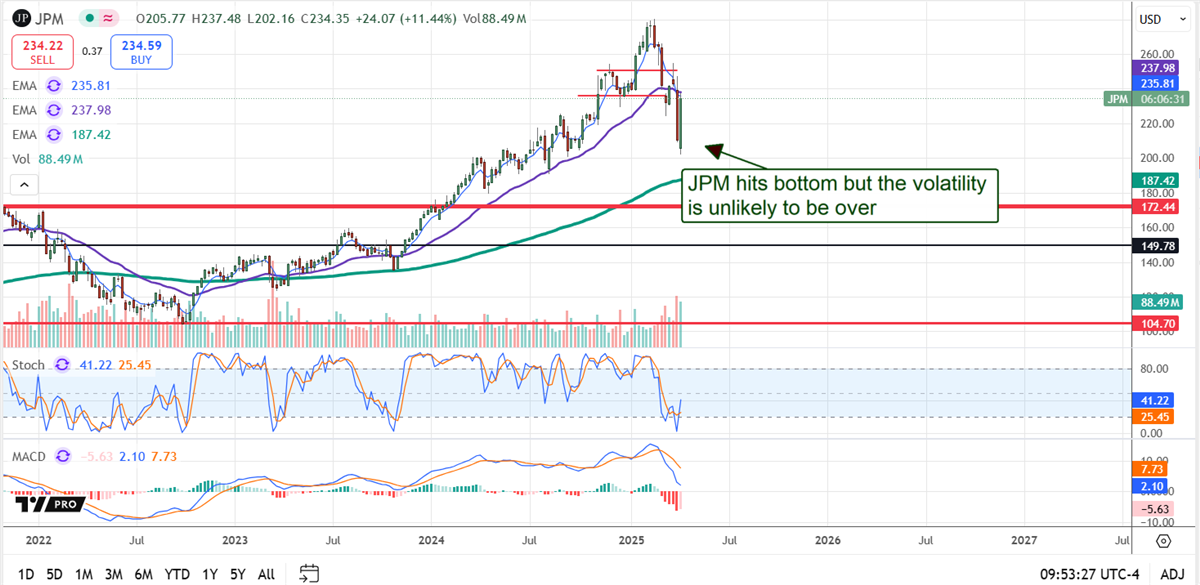
JPMorgan’s (NYSE: JPM) stock price correction most likely ended in early April, but that can’t be said of the volatility. While the business is solid, healthy, and sufficiently capitalized to weather a raging financial storm, the U.S. economy faces turbulence in the words of CEO Jamie Dimon. Turbulence driven by the uncertainty of conflicting tax, regulatory, and trade policies that bolster U.S. capability while hampering global trade.
The takeaway for investors is that JPMorgan’s stock price will see weekly fluctuations, possibly large ones, until uncertainty eases and its cash-flow-positive business will pay dividends, buy back shares, and improve its shareholder value the entire time. When the uncertainty clears, its share price will rocket higher.
JPMorgan Reaffirms 2025 Guidance After Posting Strong Q1 Results
Although some cracks appear in the consumer economy, JPMorgan’s results are solid and underscore U.S. economic health, leading into the tariff period. The company's revenue grew by 9.7% to $46 billion, outpacing MarketBeat’s reported consensus by $1.86 billion or more than 400 basis points. The strength was driven by a system-wide 2% increase in loans and deposits, with notable strengths in the CIB and AWM segments.
In Commercial & Investment Banking, fees grew by 12% while Markets revenue grew by 21%, offset by a small 3% decline in Banking. In Asset & Wealth Management, assets under management increased by 15%, loans by 5%, and deposits by 7%.
Most of the weakness is seen in the Consumer & Community Banking segment. While investment assets and card volume increased, deposits declined, loans increased, and charge-offs followed suit. Net charge-offs increased nearly 20% across the business, with most of the losses in the card services segment. Charge-offs are reported at $2.3 billion and may increase in the coming quarters.
The margin is another area of strength, improving slightly compared to the prior year. A share count decline compounded the margin strength, leaving the adjusted EPS at $4.91, or up nearly 11% year over year, sufficient to sustain balance sheet health and capital returns.
Regarding the guidance, the company reaffirmed its previously stated targets, which included strong NII and margin performance tied to the higher interest rates.
JPMorgan’s Dividend and Buybacks are in No Danger
[content-module:DividendStats|NYSE: JPM]JPMorgan’s balance sheet shows that it can withstand financial turbulence and continue with its capital returns. Highlights from Q1 include increased capital reserves, above-target tier 1 capital ratios, and fortress-quality metrics, including sufficient capitalization, low leverage, and positive cash flow. Dividend safety is also backed up by the low 25% payout ratio and share buybacks, which reduced the share count by 1% sequentially and 3% YOY in FQ1 2025.
Institutional and analyst trends suggest this bank stock is a buy. The institutions own about 72% in early April 2025 and have been buying on balance for three consecutive quarters. The nineteen analysts tracked by MarketBeat rate it as a Moderate Buy and see the stock advancing by 10% from critical resistance targets.
The critical resistance target is the cluster of moving averages, including the 30, 150-day, and 30-month EMAs. They could cap gains while macroeconomic headwinds persist but provide a potential pivot point for the market. A move above them would signal a buy for investors that could lead to a more significant advance. The risk is that macroeconomic and U.S.-specific data will deteriorate and lead to a recession.
In that scenario, JPMorgan’s stock price is unlikely to rise as the broad market moves lower and may even set a new low, presenting an even deeper value. The question is how long until new highs are set, and could be quick or take several quarters, depending on how trade relations play out. If there is a quick resolution, JPM and the broad market will likely set new highs soon after.
Where Should You Invest $1,000 Right Now?
Before you make your next trade, you'll want to hear this.
MarketBeat keeps track of Wall Street's top-rated and best performing research analysts and the stocks they recommend to their clients on a daily basis.
Our team has identified the five stocks that top analysts are quietly whispering to their clients to buy now before the broader market catches on... and none of the big name stocks were on the list.
They believe these five stocks are the five best companies for investors to buy now...