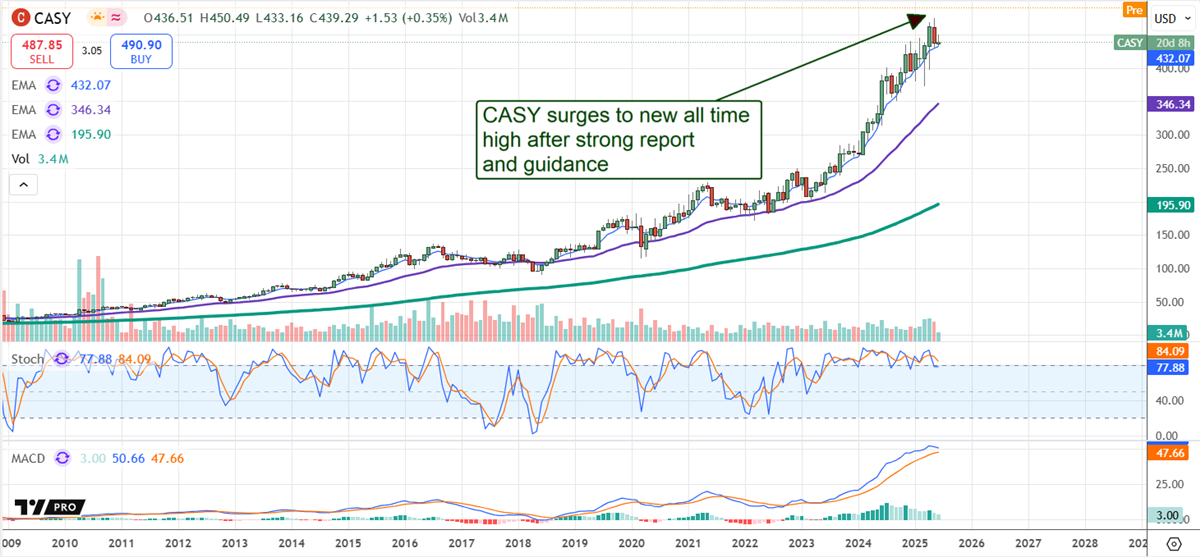
Casey’s (NASDAQ: CASY) FQ4 results, guidance for F2026, and the market’s reaction scream that this rally is just getting started. Up more than 200% in the last four years, this stock has the potential to rise by another triple-digit percentage and continue its upward trend for an extended period.
This is due to its growth, operational quality, cash flow, and capital returns. The company halted share buybacks in F2025 to prepare for the acquisition of Fikes. That acquisition is already accretive to results and investors, promising to sustain the business and capital return trajectory.
The takeaway is that the share buybacks, which halted in 2025, are likely to resume in FY2026, unless, of course, there is another significant acquisition, which would only further bolster the company’s outlook.
Until then, investors can rest assured that the dividend payment is reliable. The yield isn’t substantial, at around 0.45% with shares priced near $450, but it is incredibly safe, given that it is under 15% of the earnings forecast. The distribution is also expected to increase annually.
The company has increased for 26 consecutive years, including the 14% increase announced alongside the FQ4 results. The high, mid-teens growth pace represents an acceleration from the prior year and a pace that can be sustained for the next few years due to the healthy balance sheet.
The balance sheet details clearly show Casey’s operational quality and acquisitions. The highlights at the end of F2025 include increased liabilities and debt, offset by larger increases in cash, receivables, inventory, current assets, and total assets.
Current assets are up 22%, and total assets are up 29%, resulting in a 16% increase in shareholder equity. Shareholder equity stands at just over $3.5 billion and will likely increase again in FY2026, with leverage remaining very low. The company’s total liability is approximately 1.35x its equity, and its net long-term debt is approximately 0.7x its equity.
Yes, Casey’s Outperforms in FQ4, Issues Strong Guidance for F2026
[content-module:Forecast|NASDAQ: CASY]Casey’s had a solid quarter in FQ4 with acquisitions and comparable store strength contributing to outperformance. The company’s $3.99 billion in net revenue is up 10.8% year-over-year (YOY), driven by a 9.2% increase in store count and a 1.7% increase in inside comparable sales.
Inside comparable sales are up 7.4% in the two-year stack, producing a solid margin that is flat on a YOY basis. Fuel gallon comps were tepid at 0.1%, but the margin shone, increasing more than 1 cent per gallon to drive a leveraged 21.45% increase in operating profit.
Regarding inside sales, the company reported strength in the grocery and prepared foods segments, which increased by more than 1.5% YOY.
The margin news is an area of strength for this retailer that investors should closely monitor. The solid inside margin, combined with increasing fuel margins and declining costs, aided leveraged gains and outperformance on the bottom line. Key details include a 20.1% increase in EBITDA, a 13% rise in net income, and a 12.4% increase in GAAP earnings.
The best news is that the F2025 strengths are expected to carry into 2026, producing accelerated profit growth ahead of the consensus reported by MarketBeat. The company forecasts 11% EBITDA growth at the midpoint, inside sales comps near 3.5%, and flat fuel sales.
Analysts' Trends Align With Casey’s Uptrend: Expect Them to Continue
Analysts’ trends, including increasing coverage, firming sentiment, and a rising consensus price target, support the uptrend in Casey’s stock. Those trends are expected to continue following the Q4 release and guidance update, and may accelerate because of the strengths revealed.
As it stands, the consensus rating is a Moderate Buy, verging on a Strong Buy, with a consensus that forecasts a fair value of around $430 at the midpoint. That represents a 5% downside relative to the post-release open, but the revision trends are leading to the high-end range, which is $500 and a double-digit gain when reached.
Where Should You Invest $1,000 Right Now?
Before you make your next trade, you'll want to hear this.
MarketBeat keeps track of Wall Street's top-rated and best performing research analysts and the stocks they recommend to their clients on a daily basis.
Our team has identified the five stocks that top analysts are quietly whispering to their clients to buy now before the broader market catches on... and none of the big name stocks were on the list.
They believe these five stocks are the five best companies for investors to buy now...


