News Source: Optimal Blue
Optimal Blue's February 2025 Market Advantage report indicates stabilizing conforming loan share amid refinance growth and sluggish purchase activity
PLANO, Texas, March 11, 2025 (SEND2PRESS NEWSWIRE) — Optimal Blue today released its February 2025 Market Advantage mortgage data report, showing a 7% month-over-month increase in mortgage lock volume driven primarily by a surge in refinance activity. Rate-and-term refinances saw the biggest jump, rising nearly 40% as homeowners seized the opportunity to lower their monthly payments. Cash-out refinances also edged higher, while purchase lock activity remained subdued for the second consecutive month.
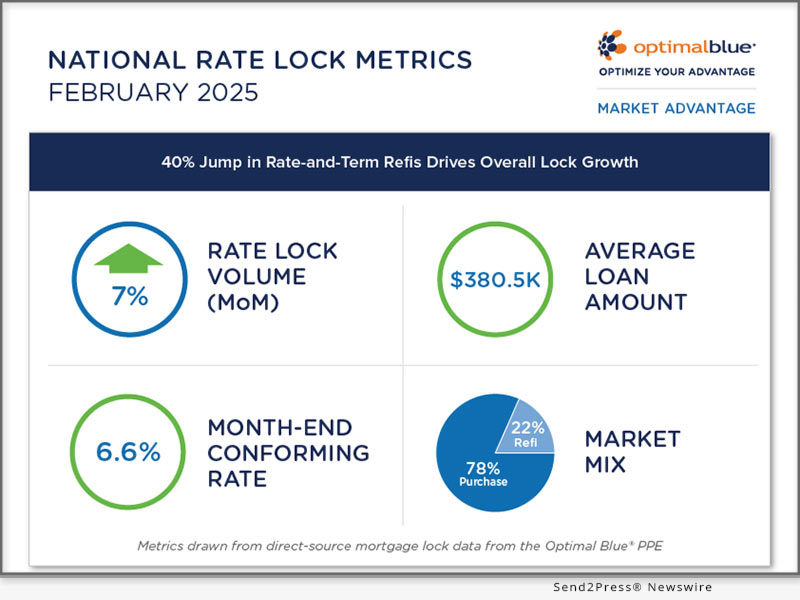
Image caption: Optimal Blue’s February 2025 Market Advantage mortgage data report.
“Interest rate improvement, while marginal, is attracting refinance activity as homeowners who bought at higher rates work the numbers and find they can reduce their monthly payments or tap into home equity,” said Brennan O’Connell, director of data solutions at Optimal Blue. “The upcoming homebuying season will reveal whether purchase demand is poised for a rebound or if elevated rates will continue to keep buyers on the sidelines.”
Key findings from the Market Advantage report, derived from direct-source mortgage lock data, include:
- Refi activity drives higher lock volume: Slightly lower interest rates encouraged a surge of refinance activity that pushed lock volume up 7% month-over-month (MoM). Most of the lift came from rate-and-term refinances, which rose nearly 40% in the improving rate environment; cash-out volume climbed a more modest 4%.
- Purchase locks continue to drag: Purchase activity remained low for the second straight month, with volume down 5% on a year-over-year (YoY) basis. Purchase lock counts – which control for home price appreciation – were down 9% from the same time in 2024.
- Conforming loan share stabilizes: Conforming loan volume edged higher for a second month, reaching 52% of total volume after hitting a multi-year low in December. FHA share remained just above 20%. VA share grew slightly to sit at around 11.5%. Non-conforming loan volume – which includes jumbo and non-QM loans – was mostly flat at 15.5%.
- Spread stays above long-term average: The mortgage rate spread to the 10-year Treasury hovered just above 230 basis points, a roughly 30 bps improvement from the same time last year but still roughly 30 to 40 bps above the long-term average.
- Refi credit quality ticks higher: The average credit score for cash-out and rate-and-term refinances rose by 2 and 4 points, respectively, to 695 and 732. Meanwhile, the average purchase credit score was flat at 737.
- Home prices, loan amounts edge higher: The average home purchase price rose from $476.2K in January to $480.2K in February, driving a MoM increase in average loan amount from $376.4K to $380.5K.
The full Market Advantage report, which provides more detailed findings and additional insights into U.S. mortgage market trends, can be viewed at (PDF): https://www2.optimalblue.com/wp-content/uploads/2025/03/OB_MarketAdvantage_MortgageDataReport_Feb2025.pdf
This month’s Market Advantage podcast features a guest interview with CoreLogic Chief Economist Selma Hepp. Access the podcast: https://market-advantage.captivate.fm/listen.
About the Market Advantage Report
Optimal Blue issues the Market Advantage mortgage data report each month to provide early insight into U.S. mortgage trends. Leveraging lender rate lock data from the Optimal Blue PPE – the mortgage industry’s most widely used product, pricing, and eligibility engine – the Market Advantage provides a view of early-stage origination activity. Unlike self-reported survey data, mortgage lock data is direct-source data that accurately reflects the in-process loans in lenders’ pipelines.
Nothing herein shall be construed as, nor is Optimal Blue providing, any legal, trading, hedging, or financial advice.
About Optimal Blue
Optimal Blue effectively bridges the primary and secondary mortgage markets to deliver the industry’s only end-to-end capital markets platform. The company helps lenders of all sizes and scopes maximize profitability and operate efficiently so they can help American borrowers achieve the dream of homeownership. Through innovative technology, a network of interconnectivity, rich data insights, and expertise gathered over more than 20 years, Optimal Blue is an experienced partner that, in any market environment, allows lenders to optimize their advantage from pricing accuracy to margin protection, and every step in between. To learn more, visit https://OptimalBlue.com/.
This press release was issued on behalf of the news source (Optimal Blue), who is solely responsible for its accuracy, by Send2Press Newswire.
To view the original story, visit: https://www.send2press.com/wire/40-jump-in-rate-and-term-refis-drives-overall-lock-growth-as-purchase-activity-stalls/
Copr. © 2025 Send2Press® Newswire, Calif., USA. -- REF: S2P STORY ID: S2P124645 FCN24-3B
INFORMATION BELOW THIS PAGE, IF ANY, IS UNRELATED TO THIS PRESS RELEASE.


