News Source: Optimal Blue
Optimal Blue's March 2025 Market Advantage report shows an increase in non-conforming share as buyers seek greater flexibility and higher loan limits
PLANO, Texas, April 8, 2025 (SEND2PRESS NEWSWIRE) — Optimal Blue today released its March 2025 Market Advantage mortgage data report, showing a 24% surge in rate lock volume as early spring buyers returned to the market and homeowners jumped at the chance to refinance into lower rates. While still down 2% on a year-over-year (YoY) basis, purchase volumes were up 21% month-over-month (MoM). Rate-and-term and cash-out refinances jumped 52% and 20% MoM, respectively, together representing 25% of all lock activity.
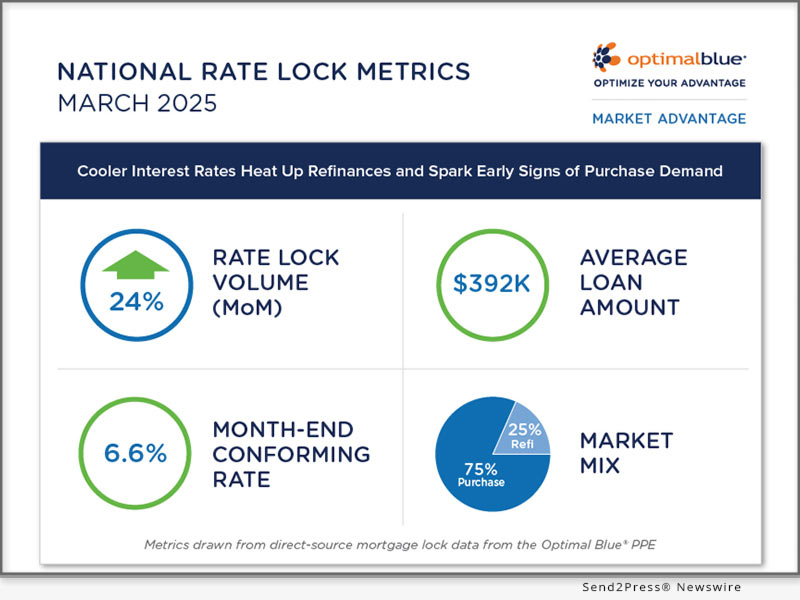
Image caption: Optimal Blue’s March 2025 Market.
“March brought a notable shift in borrower behavior,” said Brennan O’Connell, director of data solutions at Optimal Blue. “Refinances made up a quarter of all lock activity for the first time in six months, and we saw a clear rise in non-conforming loan share as buyers looked for more flexible options and higher loan amounts. These are key indicators that consumers are actively adapting to the current rate environment.”
Key findings from the Market Advantage report, derived from direct-source mortgage lock data, include:
- Refinances take share from purchase loans: Strong growth in refi activity during March pushed the share of refinances up to 25%, the highest level seen since September 2024. The pull-through rate for refinances was 63.3%.
- Purchase volume up MoM, but down YoY: Despite positive MoM momentum, purchase activity was down 2% YoY. Isolating loan counts instead of dollar volume – effectively controlling for home price appreciation – reveals an even steeper 6% decline in purchase activity. The pull-through rate for purchase loans was 82.9%.
- Non-conforming share rises: Conforming loan production continued to hover near historic lows, while non-Agency loan share hit its highest level since April of 2022. Non-conforming loans, which include jumbo and non-QM loans, accounted for 16.8% of total rate lock volume. Conforming loan share fell to 51% and FHA share dropped to 19.6%, while VA volume inched upward, reaching nearly 12% share.
- Adjustable-rate mortgages gain steam: ARMs accounted for just below 9% of total rate lock volume in March, a result tied to growing demand for non-conforming loan options. Optimal Blue will continue to monitor this data point as buyers search for greater affordability.
- Rates stay relatively flat: After a strong rally the last week of February, the OBMMI 30-year conforming fixed rate – the benchmark for the CME Group’s Mortgage Rate futures – finished the month flat at 6.6%. FHA rates fell 8 basis points (bps) to 6.27%, while VA and jumbo rates rose a modest 3 and 4 bps to 6.13% and 6.73%, respectively.
- Refi credit quality ticks higher: March saw a 3-point increase in average credit scores for both cash-out and rate-and-term refinances, rising to 735 and 699, respectively, as higher-credit homeowners acted quickly on refinance opportunities.
- DTI trends downward: The average debt-to-income (DTI) ratio across all loans dropped from February’s 37.3% to 36.7% in March, reflecting income growth outpacing the rise in household debt [*note 1]. This fall in DTI represents a healthier balance between monthly income and debt than tracked in previous months.
- Loan sizes grow alongside home prices: The average home purchase price rose from February’s $480.2K to $486.9K in March, driving a MoM increase in average loan amount from $380.5K to $391.7K.
The full Market Advantage report, which provides more detailed findings and additional insights into U.S. mortgage market trends, can be viewed at (PDF): https://www2.optimalblue.com/wp-content/uploads/2025/04/OB_MarketAdvantage_MortgageDataReport_Mar2025.pdf
This month’s Market Advantage podcast features Optimal Blue Head of Corporate Strategy Mike Vough, offering additional market insights. Watch or listen to the episode: https://market-advantage.captivate.fm/episode/episode-7/.
About the Market Advantage Report
Optimal Blue issues the Market Advantage mortgage data report each month to provide early insight into U.S. mortgage trends. Leveraging lender rate lock data from the Optimal Blue PPE – the mortgage industry’s most widely used product, pricing, and eligibility engine – the Market Advantage provides a view of early-stage origination activity. Unlike self-reported survey data, mortgage lock data is direct-source data that accurately reflects the in-process loans in lenders’ pipelines.
Nothing herein shall be construed as, nor is Optimal Blue providing, any legal, trading, hedging, or financial advice.
About Optimal Blue
Optimal Blue effectively bridges the primary and secondary mortgage markets to deliver the industry’s only end-to-end capital markets platform. The company helps lenders of all sizes and scopes maximize profitability and operate efficiently so they can help American borrowers achieve the dream of homeownership. Through innovative technology, a network of interconnectivity, rich data insights, and expertise gathered over more than 20 years, Optimal Blue is an experienced partner that, in any market environment, allows lenders to optimize their advantage from pricing accuracy to margin protection, and every step in between. To learn more, visit OptimalBlue.com.
NOTE/CITATION:
[1] https://libertystreeteconomics.newyorkfed.org/2024/11/income-growth-outpaces-household-borrowing/
This press release was issued on behalf of the news source (Optimal Blue), who is solely responsible for its accuracy, by Send2Press Newswire.
To view the original story, visit: https://www.send2press.com/wire/cooler-interest-rates-heat-up-refinances-and-spark-early-signs-of-purchase-demand/
Copr. © 2025 Send2Press® Newswire, Calif., USA. -- REF: S2P STORY ID: S2P125367 FCN24-3B
INFORMATION BELOW THIS PAGE, IF ANY, IS UNRELATED TO THIS PRESS RELEASE.


