
Auto parts and accessories retailer O’Reilly Automotive (NASDAQ: ORLY) missed Wall Street’s revenue expectations in Q3 CY2024 as sales rose 3.8% year on year to $4.36 billion. On the other hand, the company’s outlook for the full year was close to analysts’ estimates with revenue guided to $16.7 billion at the midpoint. Its GAAP profit of $11.41 per share was also 1.1% below analysts’ consensus estimates.
Is now the time to buy O'Reilly? Find out by accessing our full research report, it’s free.
O'Reilly (ORLY) Q3 CY2024 Highlights:
- Revenue: $4.36 billion vs analyst estimates of $4.42 billion (1.3% miss)
- EPS: $11.41 vs analyst expectations of $11.54 (1.1% miss)
- The company reconfirmed its revenue guidance for the full year of $16.7 billion at the midpoint
- EPS (GAAP) guidance for the full year is $40.85 at the midpoint, roughly in line with what analysts were expecting
- Gross Margin (GAAP): 51.6%, in line with the same quarter last year
- Operating Margin: 20.5%, in line with the same quarter last year
- Free Cash Flow Margin: 11.5%, down from 13.4% in the same quarter last year
- Locations: 6,291 at quarter end, up from 6,111 in the same quarter last year
- Same-Store Sales rose 1.5% year on year (8.7% in the same quarter last year)
- Market Capitalization: $69.92 billion
Company Overview
Serving both the DIY customer and professional mechanic, O’Reilly Automotive (NASDAQ: ORLY) is an auto parts and accessories retailer that sells everything from fuel pumps to car air fresheners to mufflers.
Auto Parts Retailer
Cars are complex machines that need maintenance and occasional repairs, and auto parts retailers cater to the professional mechanic as well as the do-it-yourself (DIY) fixer. Work on cars may entail replacing fluids, parts, or accessories, and these stores have the parts and accessories or these jobs. While e-commerce competition presents a risk, these stores have a leg up due to the combination of broad and deep selection as well as expertise provided by sales associates. Another change on the horizon could be the increasing penetration of electric vehicles.
Sales Growth
Examining a company’s long-term performance can provide clues about its business quality. Any business can put up a good quarter or two, but the best consistently grow over the long haul.
O'Reilly is one of the larger companies in the consumer retail industry and benefits from a well-known brand that influences consumer purchasing decisions.
As you can see below, O'Reilly’s 10.5% annualized revenue growth over the last five years (we compare to 2019 to normalize for COVID-19 impacts) was decent as it opened new stores and increased sales at existing, established locations.
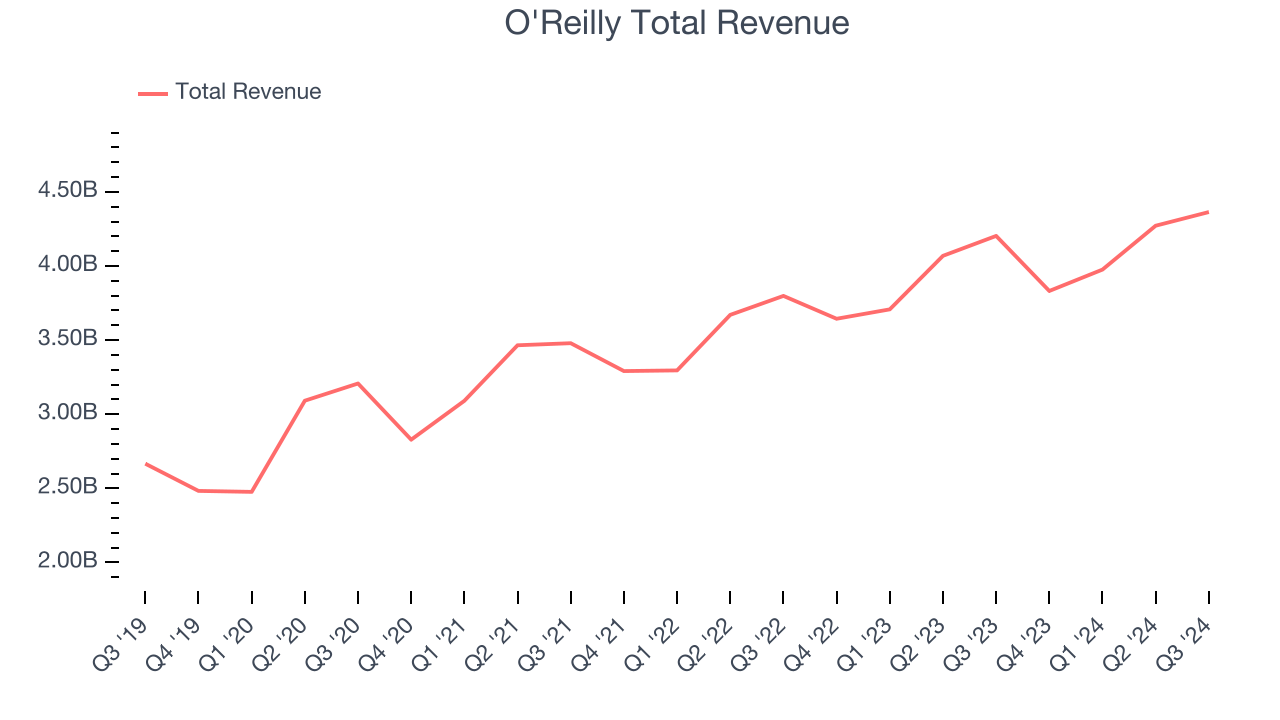
This quarter, O'Reilly’s revenue grew 3.8% year on year to $4.36 billion, falling short of Wall Street’s estimates.
Looking ahead, sell-side analysts expect revenue to grow 6.3% over the next 12 months, a deceleration versus the last five years. Some tapering is natural given the magnitude of its revenue base, and we still think its growth trajectory is attractive.
Unless you’ve been living under a rock, it should be obvious by now that generative AI is going to have a huge impact on how large corporations do business. While Nvidia and AMD are trading close to all-time highs, we prefer a lesser-known (but still profitable) semiconductor stock benefitting from the rise of AI. Click here to access our free report on our favorite semiconductor growth story.
Store Performance
Number of Stores
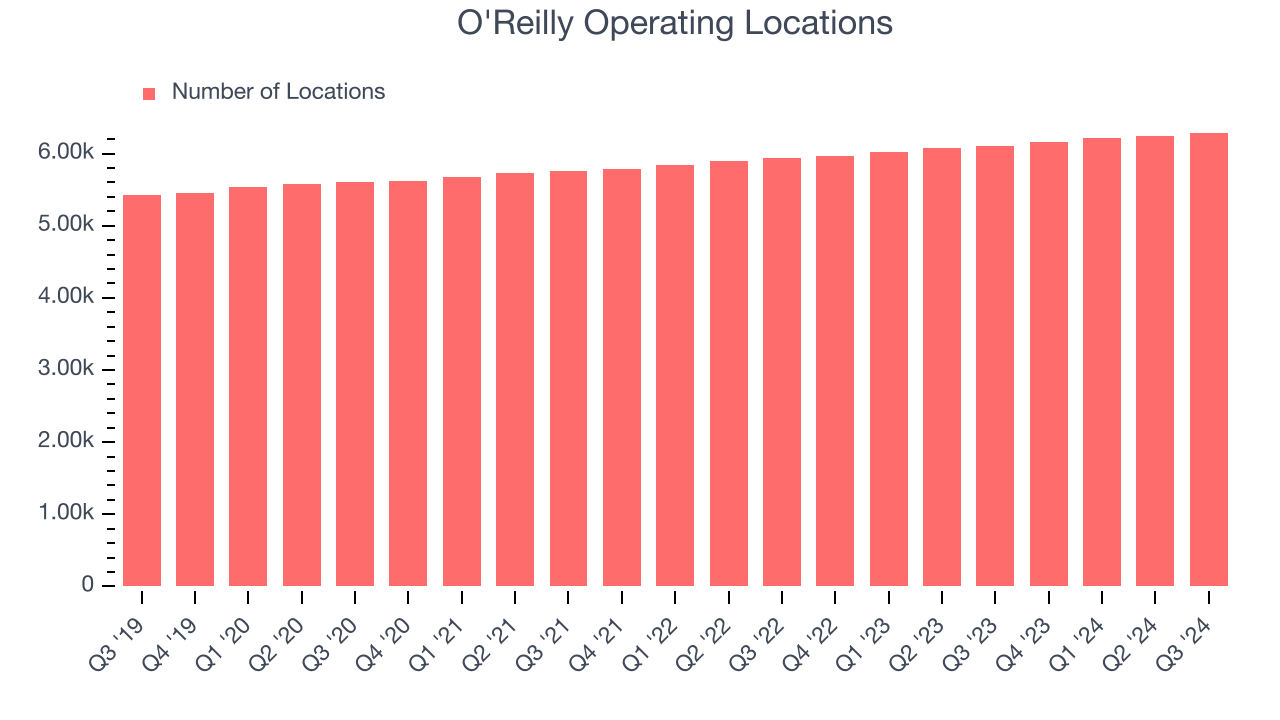
The number of stores a retailer operates is a critical driver of how quickly company-level sales can grow.
O'Reilly operated 6,291 locations in the latest quarter. It has opened new stores quickly over the last two years and averaged 3% annual growth, faster than the broader consumer retail sector.
When a retailer opens new stores, it usually means it’s investing for growth because demand is greater than supply, especially in areas where consumers may not have a store within reasonable driving distance.
Same-Store Sales
The change in a company's store base only tells one side of the story. The other is the performance of its existing locations and e-commerce sales. Same-store sales gives us insight into this topic because it measures organic growth for a retailer's e-commerce platform and brick-and-mortar shops that have existed for at least a year.
O'Reilly has been one of the most successful retailers over the last two years thanks to skyrocketing demand within its existing locations. On average, the company has posted exceptional year-on-year same-store sales growth of 6%. This performance suggests its rollout of new stores is beneficial for shareholders. We like this backdrop as O'Reilly has multiple ways to win: revenue growth can come from new stores, e-commerce, or increased foot traffic and higher sales per customer at existing locations.
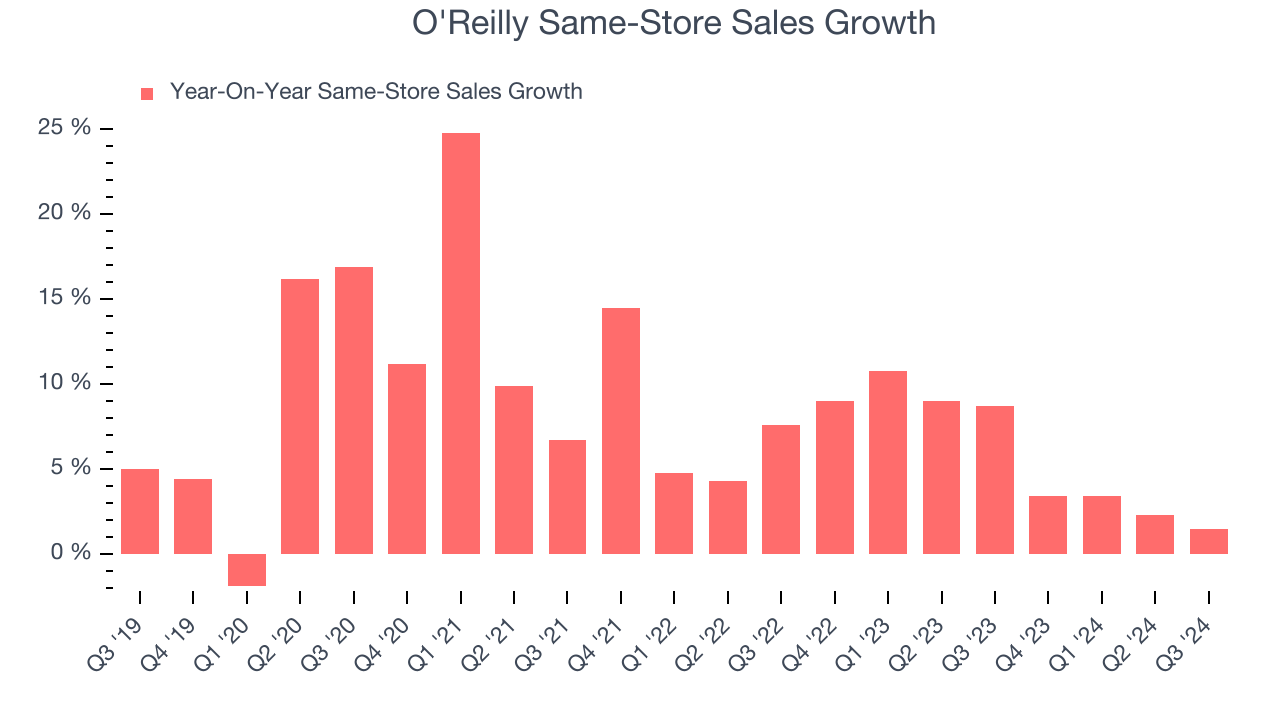
In the latest quarter, O'Reilly’s same-store sales rose 1.5% annually. By the company’s standards, this growth was a meaningful deceleration from the 8.7% year-on-year increase it posted 12 months ago. We’ll be watching O'Reilly closely to see if it can reaccelerate growth.
Key Takeaways from O'Reilly’s Q3 Results
It was unfortunate to see O'Reilly miss analysts revenue and EPS expectations this quarter. On top of that, its EPS guidance for the full year fell short of Wall Street’s estimates. Zooming out, we think this was a mixed quarter. The stock traded down 2.6% to $1,168 immediately following the results.
So do we think O'Reilly is an attractive buy at the current price?If you’re making that decision, you should consider the bigger picture of valuation, business qualities, as well as the latest earnings. We cover that in our actionable full research report which you can read here, it’s free.


