Electrical and electronic products company Hubbell (NYSE: HUBB) fell short of the market’s revenue expectations in Q3 CY2024 as sales rose 4.9% year on year to $1.44 billion. Its non-GAAP profit of $4.49 per share wasin line with analysts’ consensus estimates.
Is now the time to buy Hubbell? Find out by accessing our full research report, it’s free.
Hubbell (HUBB) Q3 CY2024 Highlights:
- Revenue: $1.44 billion vs analyst estimates of $1.48 billion (2.7% miss)
- Adjusted EPS: $4.49 vs analyst expectations of $4.46 (in line)
- EBITDA: $353.1 million vs analyst estimates of $357 million (1.1% miss)
- Management slightly raised its full-year Adjusted EPS guidance to $16.45 at the midpoint
- Gross Margin (GAAP): 34.5%, down from 35.5% in the same quarter last year
- Operating Margin: 21.1%, in line with the same quarter last year
- EBITDA Margin: 24.5%, up from 22.8% in the same quarter last year
- Free Cash Flow Margin: 15.7%, up from 11.6% in the same quarter last year
- Organic Revenue fell 1% year on year (3.5% in the same quarter last year)
- Market Capitalization: $24.14 billion
“Hubbell delivered strong operating performance in the third quarter, generating solid operating margin expansion and double digit growth in operating income” said Gerben Bakker, Chairman, President and CEO.
Company Overview
A respected player in the electrical segment, Hubbell (NYSE: HUBB) manufactures electronic products for the construction, industrial, utility, and telecommunications markets.
Electrical Systems
Like many equipment and component manufacturers, electrical systems companies are buoyed by secular trends such as connectivity and industrial automation. More specific pockets of strong demand include Internet of Things (IoT) connectivity and the 5G telecom upgrade cycle, which can benefit companies whose cables and conduits fit those needs. But like the broader industrials sector, these companies are also at the whim of economic cycles. Interest rates, for example, can greatly impact projects that drive demand for these products.
Sales Growth
A company’s long-term performance can indicate its business quality. Any business can put up a good quarter or two, but many enduring ones grow for years. Over the last five years, Hubbell grew its sales at a sluggish 4% compounded annual growth rate. This shows it failed to expand in any major way, a rough starting point for our analysis.
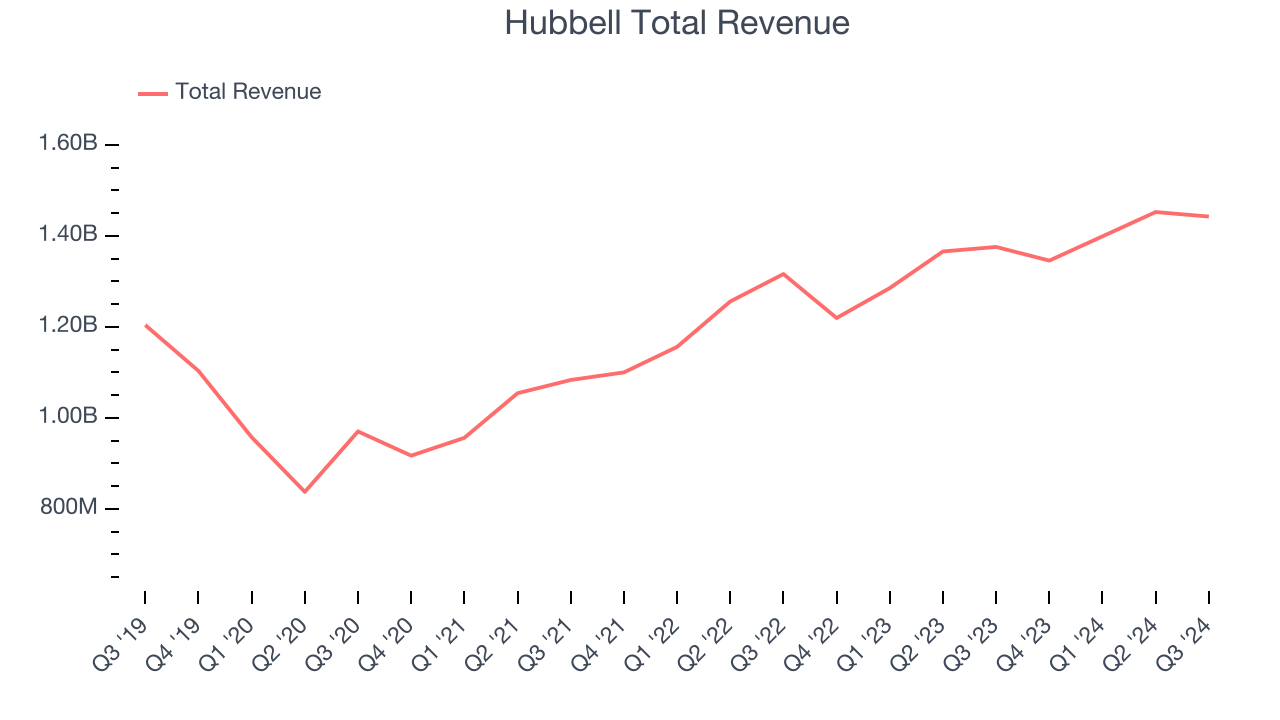
We at StockStory place the most emphasis on long-term growth, but within industrials, a half-decade historical view may miss cycles, industry trends, or a company capitalizing on catalysts such as a new contract win or a successful product line. Hubbell’s annualized revenue growth of 8.1% over the last two years is above its five-year trend, suggesting some bright spots. We also think Hubbell’s is one of the better Electrical Systems businesses as many of its peers faced declining sales because of cyclical headwinds. 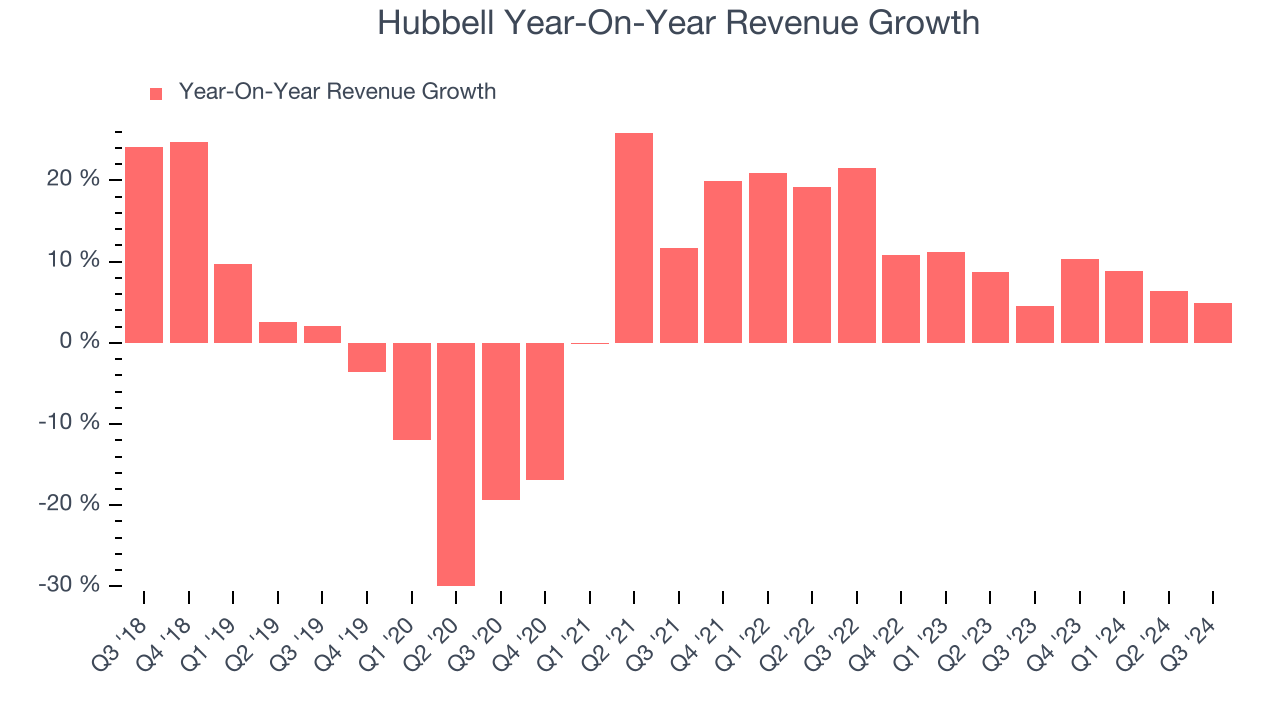
Hubbell also reports organic revenue, which strips out one-time events like acquisitions and currency fluctuations because they don’t accurately reflect its fundamentals. Over the last two years, Hubbell’s organic revenue averaged 4.9% year-on-year growth. Because this number is lower than its normal revenue growth, we can see that some mixture of acquisitions and foreign exchange rates boosted its headline performance. 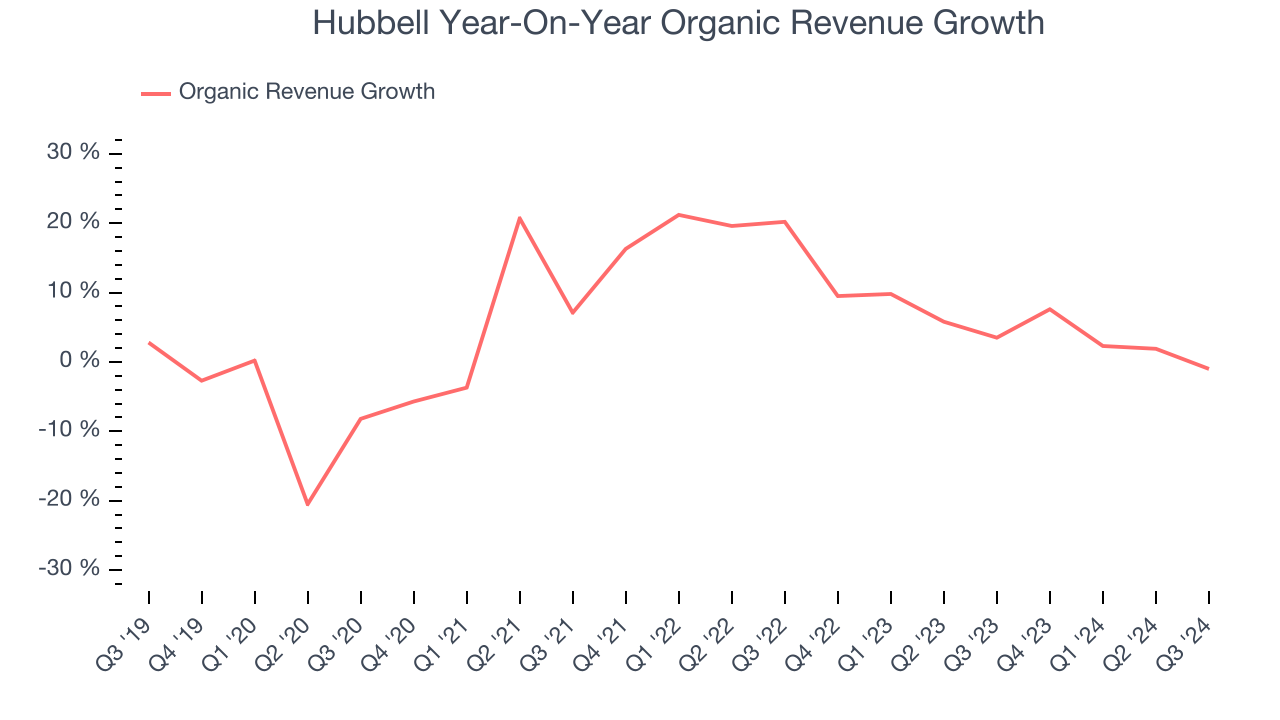
This quarter, Hubbell’s revenue grew 4.9% year on year to $1.44 billion, falling short of Wall Street’s estimates.
Looking ahead, sell-side analysts expect revenue to grow 6% over the next 12 months, a slight deceleration versus the last two years. This projection doesn't excite us and illustrates the market thinks its products and services will face some demand challenges. At least the company is tracking well in other measures of financial health.
Today’s young investors won’t have read the timeless lessons in Gorilla Game: Picking Winners In High Technology because it was written more than 20 years ago when Microsoft and Apple were first establishing their supremacy. But if we apply the same principles, then enterprise software stocks leveraging their own generative AI capabilities may well be the Gorillas of the future. So, in that spirit, we are excited to present our Special Free Report on a profitable, fast-growing enterprise software stock that is already riding the automation wave and looking to catch the generative AI next.
Operating Margin
Operating margin is one of the best measures of profitability because it tells us how much money a company takes home after procuring and manufacturing its products, marketing and selling them, and, most importantly, keeping them relevant through research and development.
Hubbell has been a well-oiled machine over the last five years. It demonstrated elite profitability for an industrials business, boasting an average operating margin of 15.9%.
Analyzing the trend in its profitability, Hubbell’s annual operating margin rose by 5.4 percentage points over the last five years, showing its efficiency has meaningfully improved.
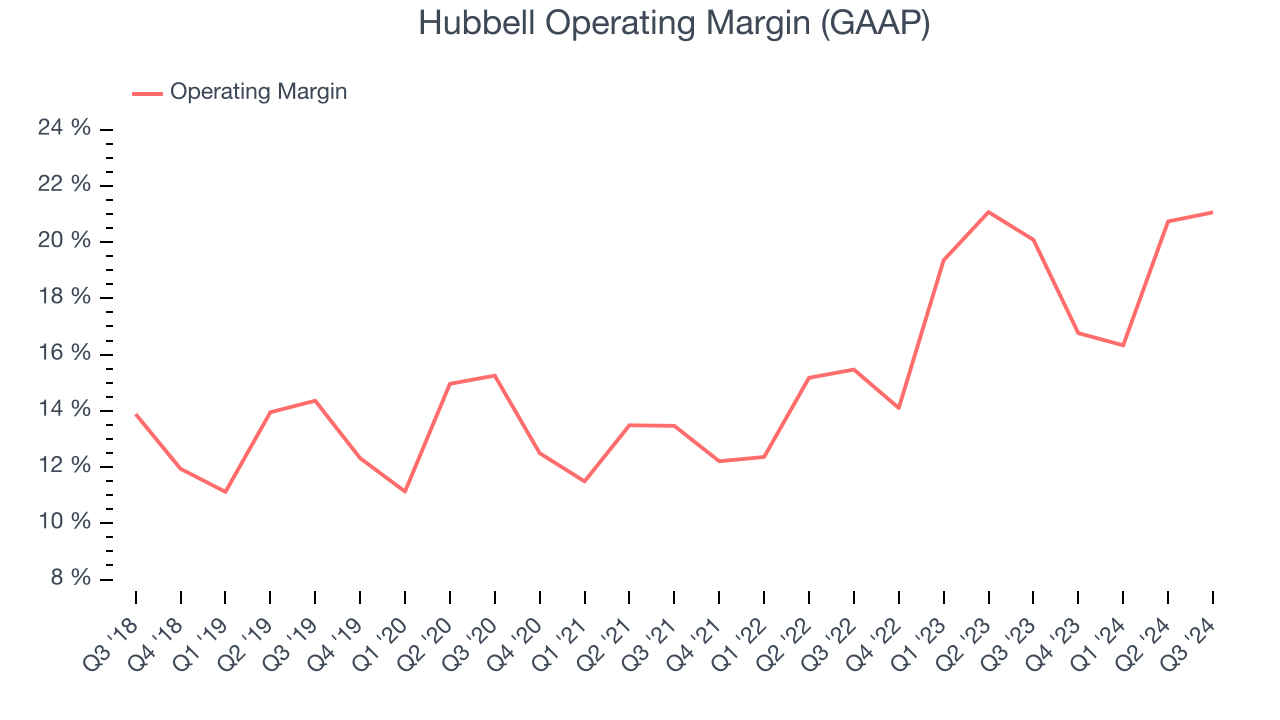
In Q3, Hubbell generated an operating profit margin of 21.1%, in line with the same quarter last year. This indicates the company’s cost structure has recently been stable.
Earnings Per Share
Analyzing revenue trends tells us about a company’s historical growth, but the long-term change in its earnings per share (EPS) points to the profitability of that growth – for example, a company could inflate its sales through excessive spending on advertising and promotions.
Hubbell’s EPS grew at a spectacular 14.9% compounded annual growth rate over the last five years, higher than its 4% annualized revenue growth. This tells us the company became more profitable as it expanded.
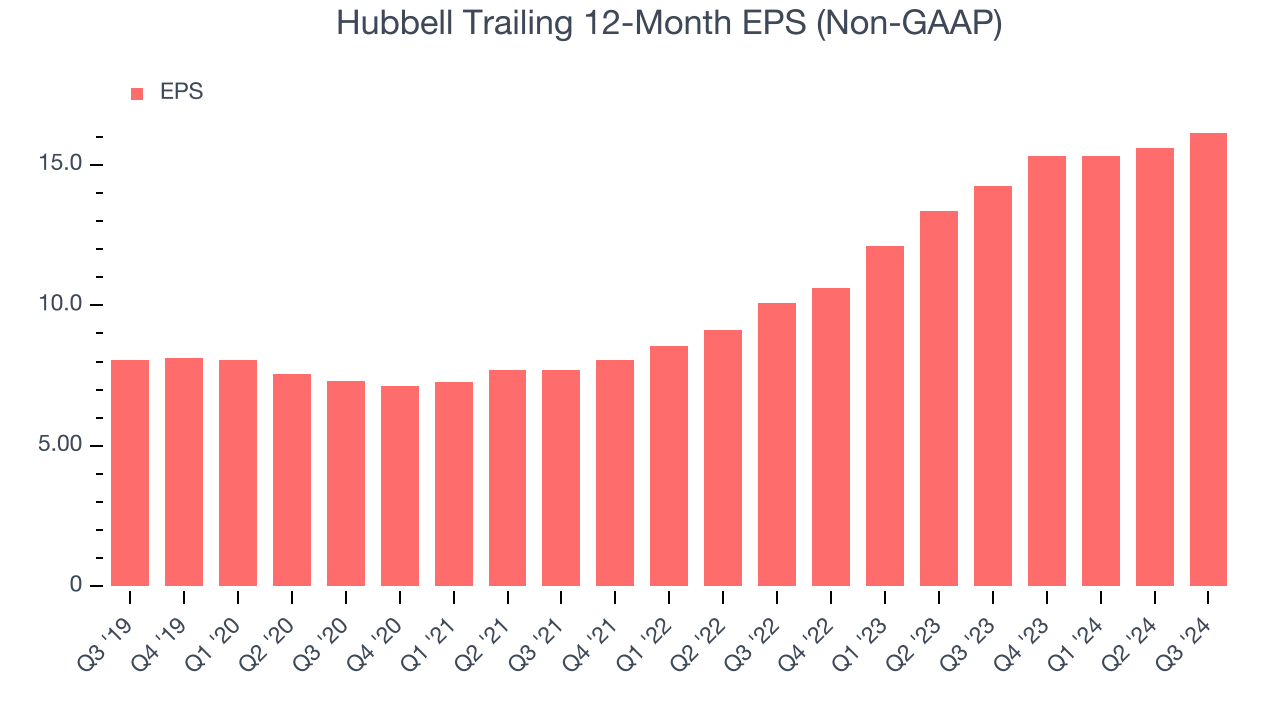
We can take a deeper look into Hubbell’s earnings to better understand the drivers of its performance. As we mentioned earlier, Hubbell’s operating margin was flat this quarter but expanded by 5.4 percentage points over the last five years. On top of that, its share count shrank by 1.1%. These are positive signs for shareholders because improving profitability and share buybacks turbocharge EPS growth relative to revenue growth. 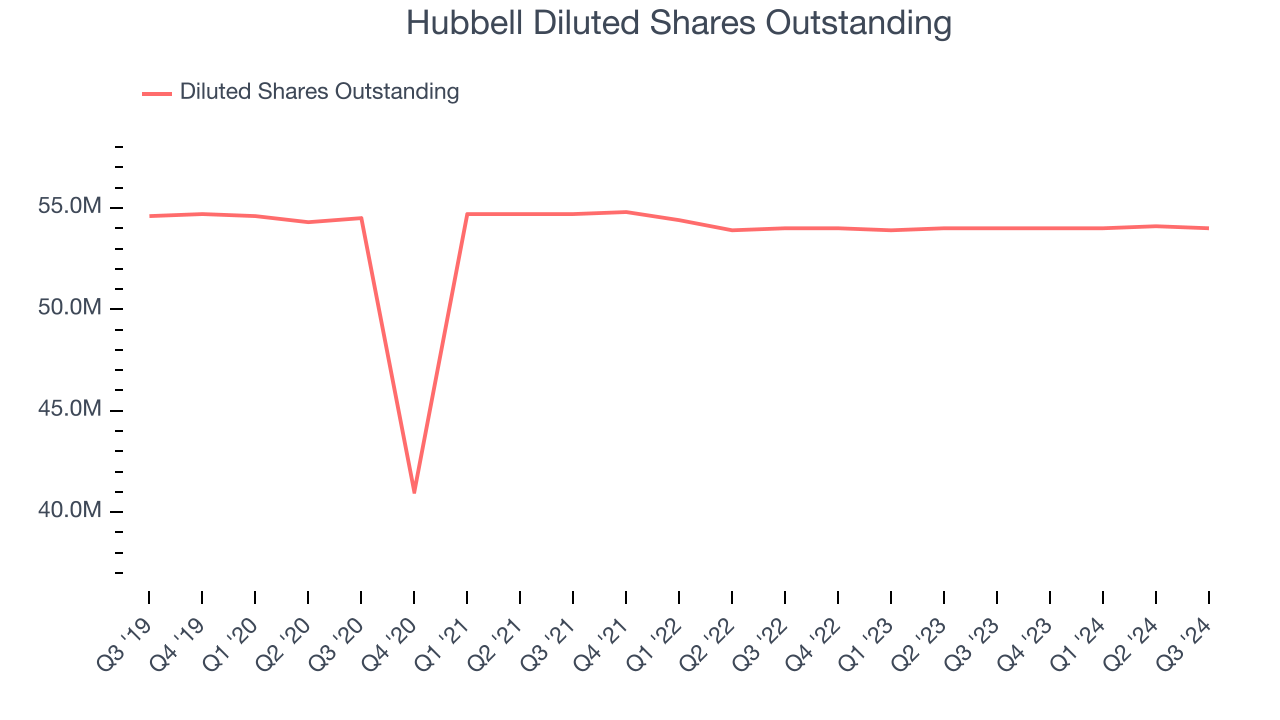
Like with revenue, we analyze EPS over a shorter period to see if we are missing a change in the business.
For Hubbell, its two-year annual EPS growth of 26.6% was higher than its five-year trend. We love it when earnings growth accelerates, especially when it accelerates off an already high base.In Q3, Hubbell reported EPS at $4.49, up from $3.95 in the same quarter last year. This print was close to analysts’ estimates. Over the next 12 months, Wall Street expects Hubbell’s full-year EPS of $16.15 to grow by 7.8%.
Key Takeaways from Hubbell’s Q3 Results
Full year EPS guidance was raised. Other than that, the results were underwhelming. Its revenue unfortunately missed and its organic revenue fell short Wall Street’s estimates. Overall, this was a weaker quarter. The stock traded down 2.2% to $440 immediately following the results.
Hubbell’s earnings report left more to be desired. Let’s look forward to see if this quarter has created an opportunity to buy the stock. The latest quarter does matter, but not nearly as much as longer-term fundamentals and valuation, when deciding if the stock is a buy. We cover that in our actionable full research report which you can read here, it’s free.