Telecommunications and media company Comcast (NASDAQ: CMCSA) beat Wall Street’s revenue expectations in Q3 CY2024, with sales up 6.5% year on year to $32.07 billion. Its non-GAAP profit of $1.12 per share was also 5.3% above analysts’ consensus estimates.
Is now the time to buy Comcast? Find out by accessing our full research report, it’s free.
Comcast (CMCSA) Q3 CY2024 Highlights:
- Revenue: $32.07 billion vs analyst estimates of $31.71 billion (1.1% beat)
- Adjusted EPS: $1.12 vs analyst estimates of $1.06 (5.3% beat)
- EBITDA: $9.74 billion vs analyst estimates of $9.60 billion (1.4% beat)
- Gross Margin (GAAP): 68.1%, down from 71.3% in the same quarter last year
- Operating Margin: 18.3%, down from 21.5% in the same quarter last year
- EBITDA Margin: 30.4%, down from 33.1% in the same quarter last year
- Free Cash Flow Margin: 10.6%, down from 13.4% in the same quarter last year
- Domestic Broadband Customers: 31.98 million, in line with the same quarter last year (slight beat vs expectations of 31.92 million)
- Market Capitalization: $163.6 billion
Company Overview
Formerly known as American Cable Systems, Comcast (NASDAQ: CMCSA) is a multinational telecommunications company offering a wide range of services.
Wireless, Cable and Satellite
The massive physical footprints of cell phone towers, fiber in the ground, or satellites in space make it challenging for companies in this industry to adjust to shifting consumer habits. Over the last decade-plus, consumers have ‘cut the cord’ to their landlines and traditional cable subscriptions in favor of wireless communications and streaming video. These trends do mean that more households need cell phone plans and high-speed internet. Companies that successfully serve customers can enjoy high retention rates and pricing power since the options for mobile and internet connectivity in any geography are usually limited.
Sales Growth
A company’s long-term performance is an indicator of its overall business quality. While any business can experience short-term success, top-performing ones enjoy sustained growth for multiple years. Over the last five years, Comcast grew its sales at a weak 2.5% compounded annual growth rate. This shows it failed to expand in any major way, a rough starting point for our analysis.
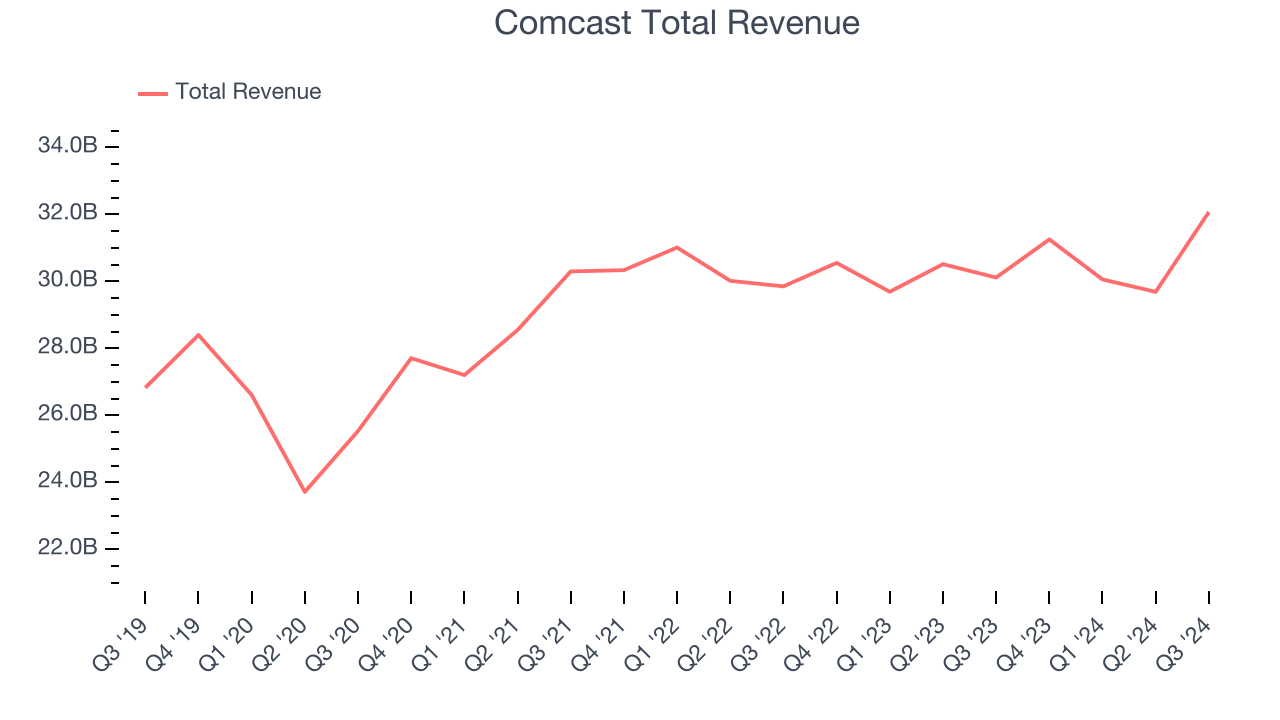
Long-term growth is the most important, but within consumer discretionary, product cycles are short and revenue can be hit-driven due to rapidly changing trends and consumer preferences. Comcast’s recent history shows its demand slowed as its revenue was flat over the last two years. 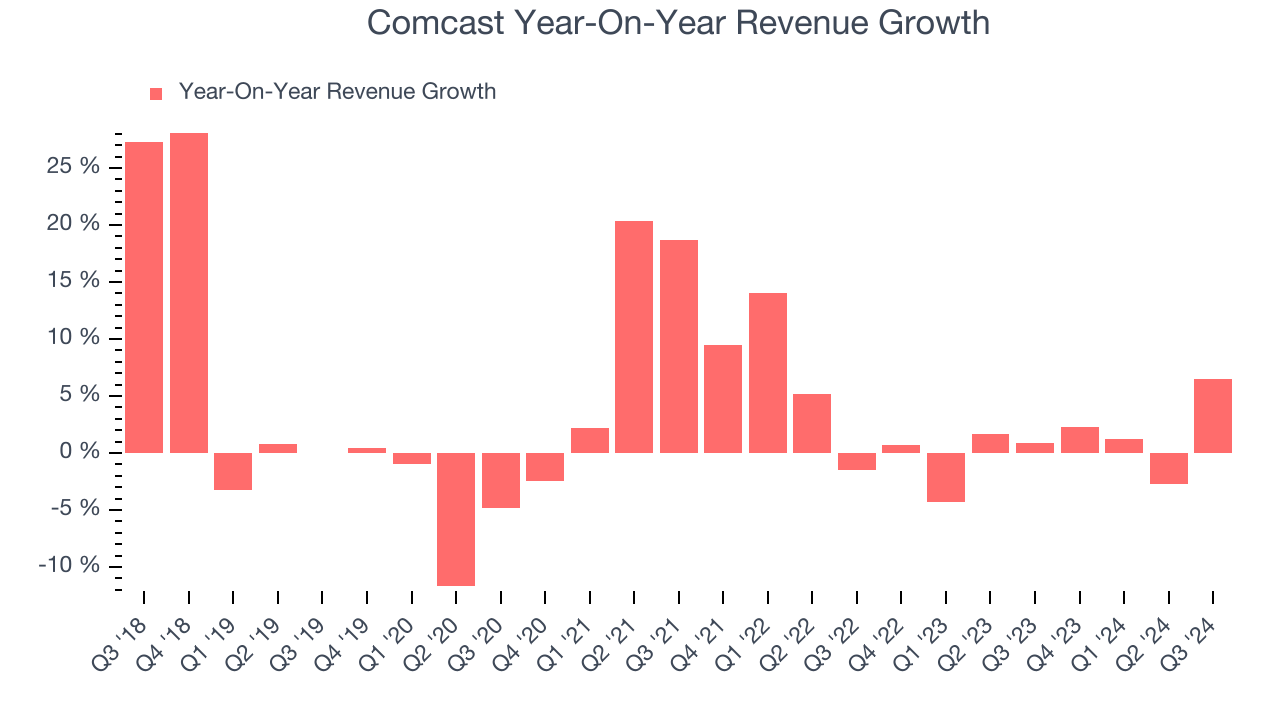
We can dig further into the company’s revenue dynamics by analyzing its number of domestic broadband customers and domestic video customers, which clocked in at 31.98 million and 12.83 million in the latest quarter. Over the last two years, Comcast’s domestic broadband customers were flat while its domestic video customers averaged 12.1% year-on-year declines. 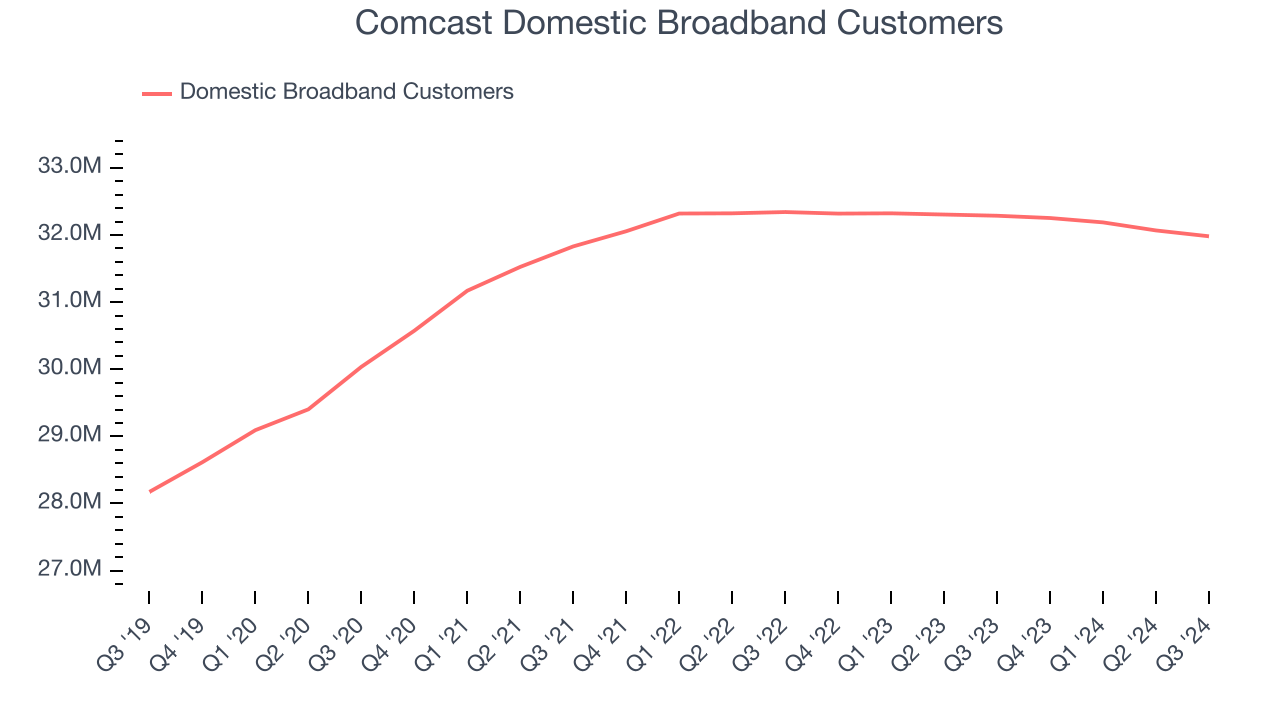
This quarter, Comcast reported year-on-year revenue growth of 6.5%, and its $32.07 billion of revenue exceeded Wall Street’s estimates by 1.1%.
Looking ahead, sell-side analysts expect revenue to remain flat over the next 12 months, a slight deceleration versus the last two years. This projection doesn't excite us and shows the market believes its products and services will face some demand challenges.
Here at StockStory, we certainly understand the potential of thematic investing. Diverse winners from Microsoft (MSFT) to Alphabet (GOOG), Coca-Cola (KO) to Monster Beverage (MNST) could all have been identified as promising growth stories with a megatrend driving the growth. So, in that spirit, we’ve identified a relatively under-the-radar profitable growth stock benefitting from the rise of AI, available to you FREE via this link.
Cash Is King
Although earnings are undoubtedly valuable for assessing company performance, we believe cash is king because you can’t use accounting profits to pay the bills.
Comcast has shown mediocre cash profitability over the last two years, giving the company limited opportunities to return capital to shareholders. Its free cash flow margin averaged 9.7%, subpar for a consumer discretionary business. The divergence from its good operating margin stems from its capital-intensive business model, which requires Comcast to make large cash investments in working capital and capital expenditures.
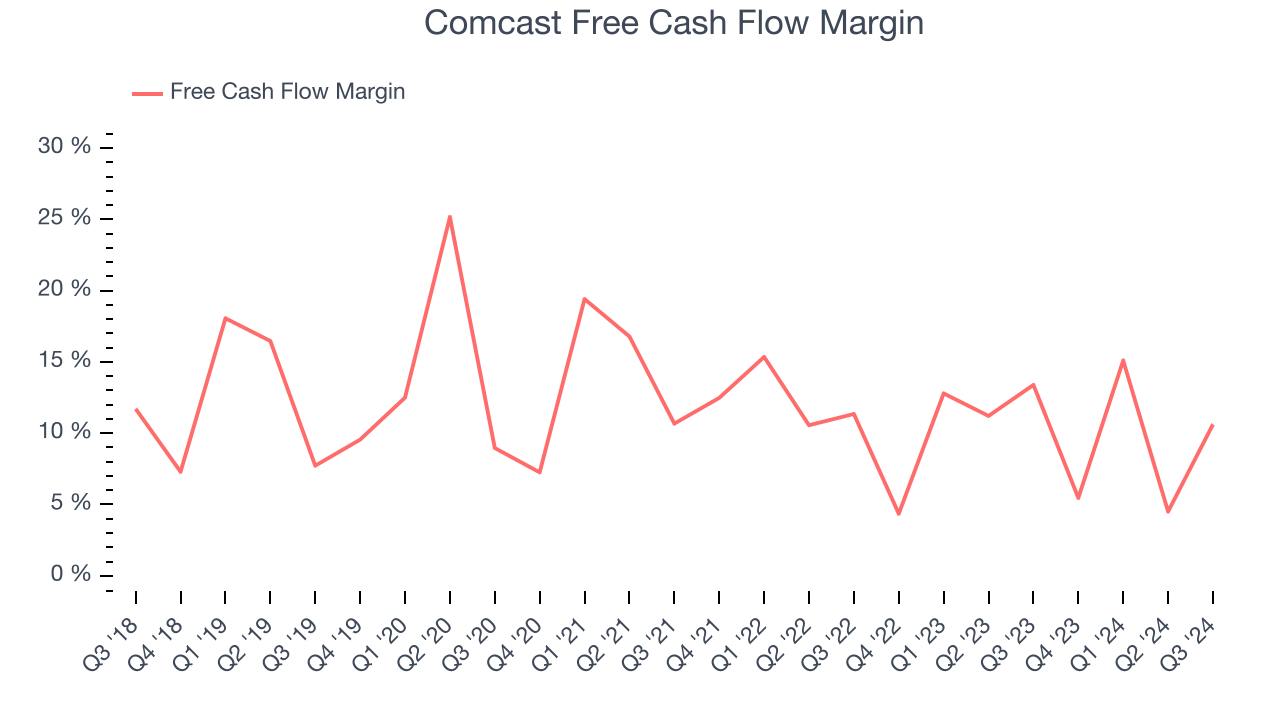
Comcast’s free cash flow clocked in at $3.41 billion in Q3, equivalent to a 10.6% margin. The company’s cash profitability regressed as it was 2.8 percentage points lower than in the same quarter last year, prompting us to pay closer attention. Short-term fluctuations typically aren’t a big deal because investment needs can be seasonal, but we’ll be watching to see if the trend extrapolates into future quarters.
Over the next year, analysts predict Comcast’s cash conversion will improve. Their consensus estimates imply its free cash flow margin of 8.9% for the last 12 months will increase to 11.8%, it options for capital deployment (investments, share buybacks, etc.).
Key Takeaways from Comcast’s Q3 Results
We were happy Comcast's revenue narrowly outperformed Wall Street’s estimates, driven by a slightly higher-than-expected domestic broadband subscriber count, a closely-watched volume metric. It also was encouraging to see the company slightly top analysts’ EPS expectations this quarter. Overall, this quarter had some key positives. The stock traded up 5.5% to $44.62 immediately after reporting.
So should you invest in Comcast right now? When making that decision, it’s important to consider its valuation, business qualities, as well as what has happened in the latest quarter. We cover that in our actionable full research report which you can read here, it’s free.