Fast-food chain Wendy’s (NASDAQ: WEN) reported Q3 CY2024 results beating Wall Street’s revenue expectations, with sales up 2.9% year on year to $566.7 million. Its non-GAAP profit of $0.25 per share wasin line with analysts’ consensus estimates.
Is now the time to buy Wendy's? Find out by accessing our full research report, it’s free.
Wendy's (WEN) Q3 CY2024 Highlights:
- Revenue: $566.7 million vs analyst estimates of $560 million (1.2% beat)
- Adjusted EPS: $0.25 vs analyst expectations of $0.25 (in line)
- EBITDA: $135.2 million vs analyst estimates of $136.2 million (small miss)
- Management reiterated its full-year Adjusted EPS guidance of $1.00 at the midpoint
- EBITDA guidance for the full year is $540 million at the midpoint, above analyst estimates of $535.4 million
- Gross Margin (GAAP): 34.1%, down from 35.7% in the same quarter last year
- Operating Margin: 16.7%, down from 18.5% in the same quarter last year
- EBITDA Margin: 23.9%, down from 25.3% in the same quarter last year
- Same-Store Sales were flat year on year (2.8% in the same quarter last year)
- Market Capitalization: $4.13 billion
"Wendy's restaurants continued to deliver sales growth during the third quarter, maintaining overall traffic and dollar share in the QSR burger category," said Kirk Tanner, President and Chief Executive Officer.
Company Overview
Founded by Dave Thomas in 1969, Wendy’s (NASDAQ: WEN) is a renowned fast-food chain known for its fresh, never-frozen beef burgers, flavorful menu options, and commitment to quality.
Traditional Fast Food
Traditional fast-food restaurants are renowned for their speed and convenience, boasting menus filled with familiar and budget-friendly items. Their reputations for on-the-go consumption make them favored destinations for individuals and families needing a quick meal. This class of restaurants, however, is fighting the perception that their meals are unhealthy and made with inferior ingredients, a battle that's especially relevant today given the consumers increasing focus on health and wellness.
Sales Growth
Examining a company’s long-term performance can provide clues about its business quality. Any business can put up a good quarter or two, but the best consistently grow over the long haul.
Wendy's is a mid-sized restaurant chain, which sometimes brings disadvantages compared to larger competitors benefiting from better brand awareness and economies of scale.
As you can see below, Wendy’s sales grew at a tepid 5.7% compounded annual growth rate over the last five years (we compare to 2019 to normalize for COVID-19 impacts), but to its credit, it opened new restaurants and increased sales at existing, established dining locations.
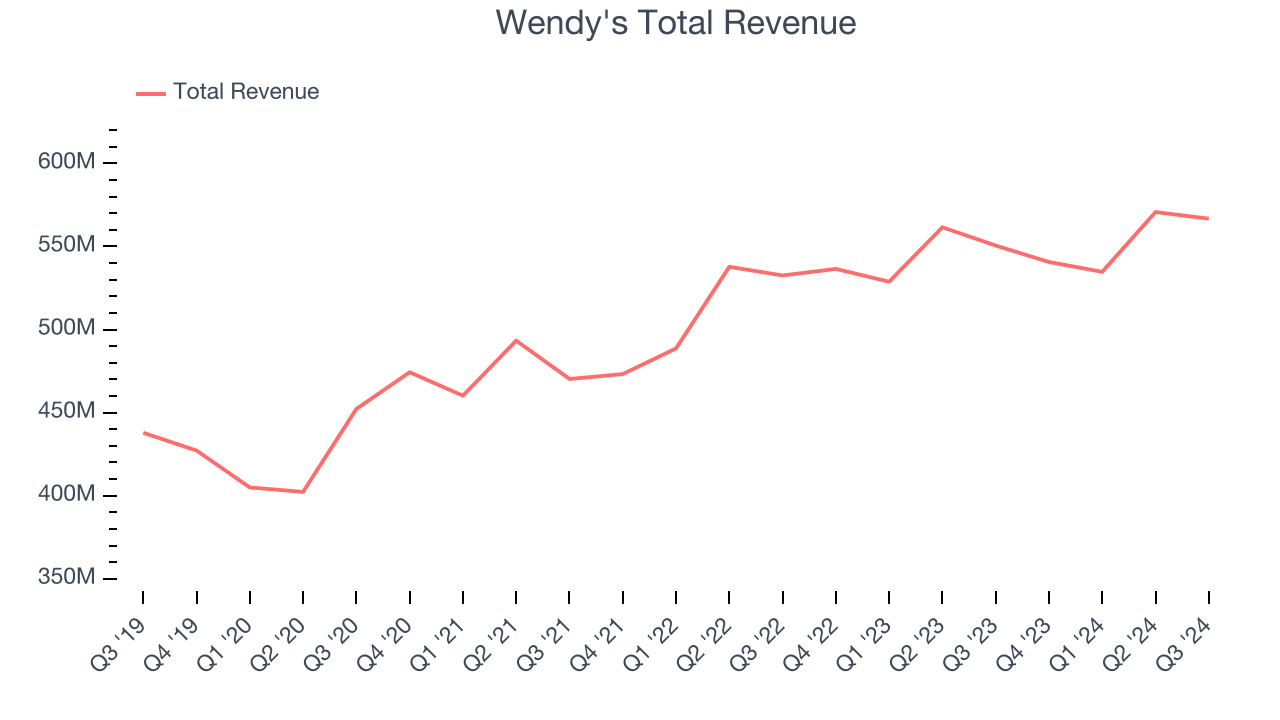
This quarter, Wendy's reported modest year-on-year revenue growth of 2.9% but beat Wall Street’s estimates by 1.2%.
Looking ahead, sell-side analysts expect revenue to grow 3.1% over the next 12 months, a slight deceleration versus the last five years. This projection is underwhelming and indicates the market thinks its offerings will see some demand headwinds.
Here at StockStory, we certainly understand the potential of thematic investing. Diverse winners from Microsoft (MSFT) to Alphabet (GOOG), Coca-Cola (KO) to Monster Beverage (MNST) could all have been identified as promising growth stories with a megatrend driving the growth. So, in that spirit, we’ve identified a relatively under-the-radar profitable growth stock benefitting from the rise of AI, available to you FREE via this link.
Restaurant Performance
Number of Restaurants
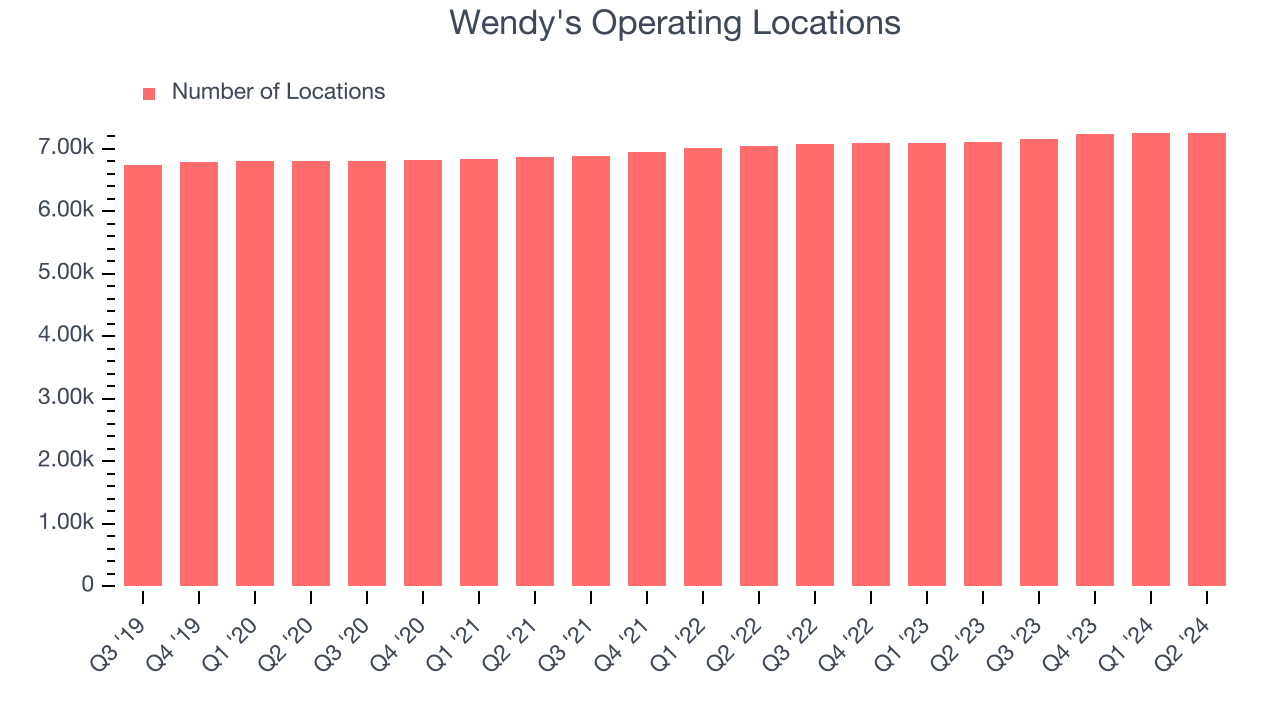
Over the last two years, Wendy's opened new restaurants quickly, averaging 1.7% annual growth. This was faster than the broader restaurant sector.
When a chain opens new restaurants, it usually means it’s investing for growth because there’s healthy demand for its meals and there are markets where the concept has few or no locations.
Note that Wendy's reports its restaurant count intermittently, so some data points are missing in the chart below.
Same-Store Sales
The change in a company's restaurant base only tells one side of the story. The other is the performance of its existing locations, which informs management teams whether they should expand or downsize their physical footprints. Same-store sales is an industry measure of whether revenue is growing at those existing restaurants and is driven by customer visits (often called traffic) and the average spending per customer (ticket).
Wendy’s demand has been healthy for a restaurant chain over the last two years. On average, the company has grown its same-store sales by a robust 3.2% per year. This performance suggests its rollout of new restaurants could be beneficial for shareholders. When a chain has demand, more locations should help it reach more customers and boost revenue growth.
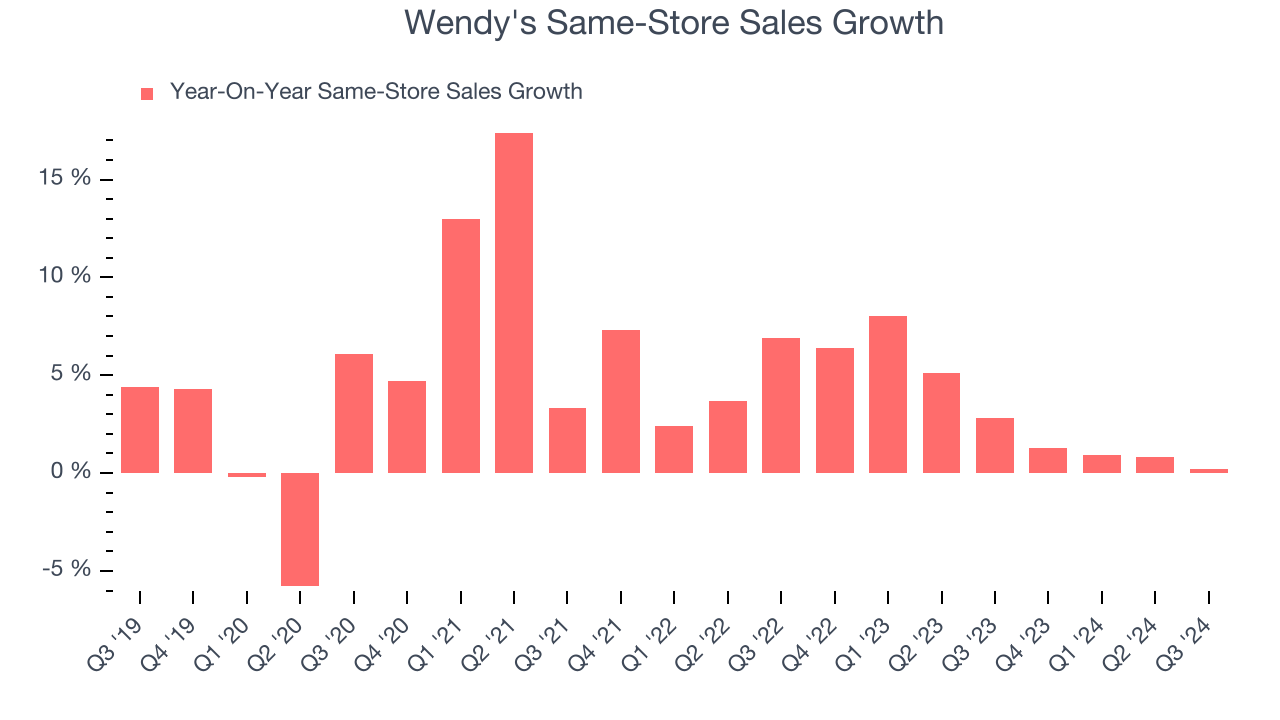
In the latest quarter, Wendy’s year on year same-store sales were flat. By the company’s standards, this growth was a meaningful deceleration from the 2.8% year-on-year increase it posted 12 months ago. We’ll be watching Wendy's closely to see if it can reaccelerate growth.
Key Takeaways from Wendy’s Q3 Results
It was good to see Wendy's beat analysts’ revenue expectations this quarter. We were also glad its full-year EBITDA guidance exceeded Wall Street’s estimates. On the other hand, its EBITDA missed. Zooming out, we think this was a decent quarter featuring some areas of strength but also some blemishes. The stock traded up 1.2% to $20.55 immediately after reporting.
So should you invest in Wendy's right now? What happened in the latest quarter matters, but not as much as longer-term business quality and valuation, when deciding whether to invest in this stock. We cover that in our actionable full research report which you can read here, it’s free.