Looking back on industrial packaging stocks’ Q3 earnings, we examine this quarter’s best and worst performers, including Sealed Air (NYSE: SEE) and its peers.
Industrial packaging companies have built competitive advantages from economies of scale that lead to advantaged purchasing and capital investments that are difficult and expensive to replicate. Recently, eco-friendly packaging and conservation are driving customers preferences and innovation. For example, plastic is not as desirable a material as it once was. Despite being integral to consumer goods ranging from beer to toothpaste to laundry detergent, these companies are still at the whim of the macro, especially consumer health and consumer willingness to spend.
The 8 industrial packaging stocks we track reported a mixed Q3. As a group, revenues missed analysts’ consensus estimates by 0.6%.
In light of this news, share prices of the companies have held steady. On average, they are relatively unchanged since the latest earnings results.
Sealed Air (NYSE: SEE)
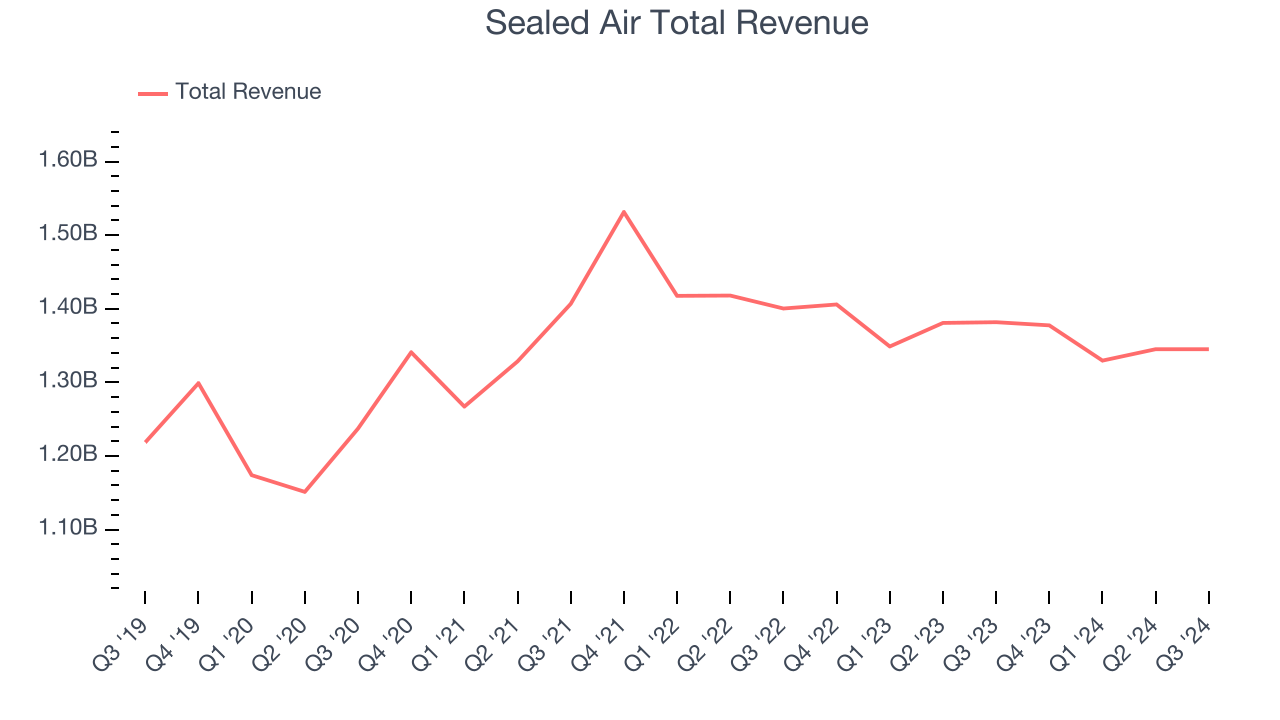
Founded in 1960, Sealed Air Corporation (NYSE: SEE) specializes in the development and production of protective and food packaging solutions, serving a variety of industries.
Sealed Air reported revenues of $1.35 billion, down 2.7% year on year. This print was in line with analysts’ expectations, and overall, it was a strong quarter for the company with an impressive beat of analysts’ adjusted operating income estimates and a solid beat of analysts’ EPS estimates.
"With the shift into two verticals, Food and Protective, and the onboarding of new leadership, we have positioned Sealed Air for long-term success," said Patrick Kivits, Sealed Air's CEO.
Unsurprisingly, the stock is down 3.9% since reporting and currently trades at $35.63.
Is now the time to buy Sealed Air? Access our full analysis of the earnings results here, it’s free.
Best Q3: International Paper (NYSE: IP)
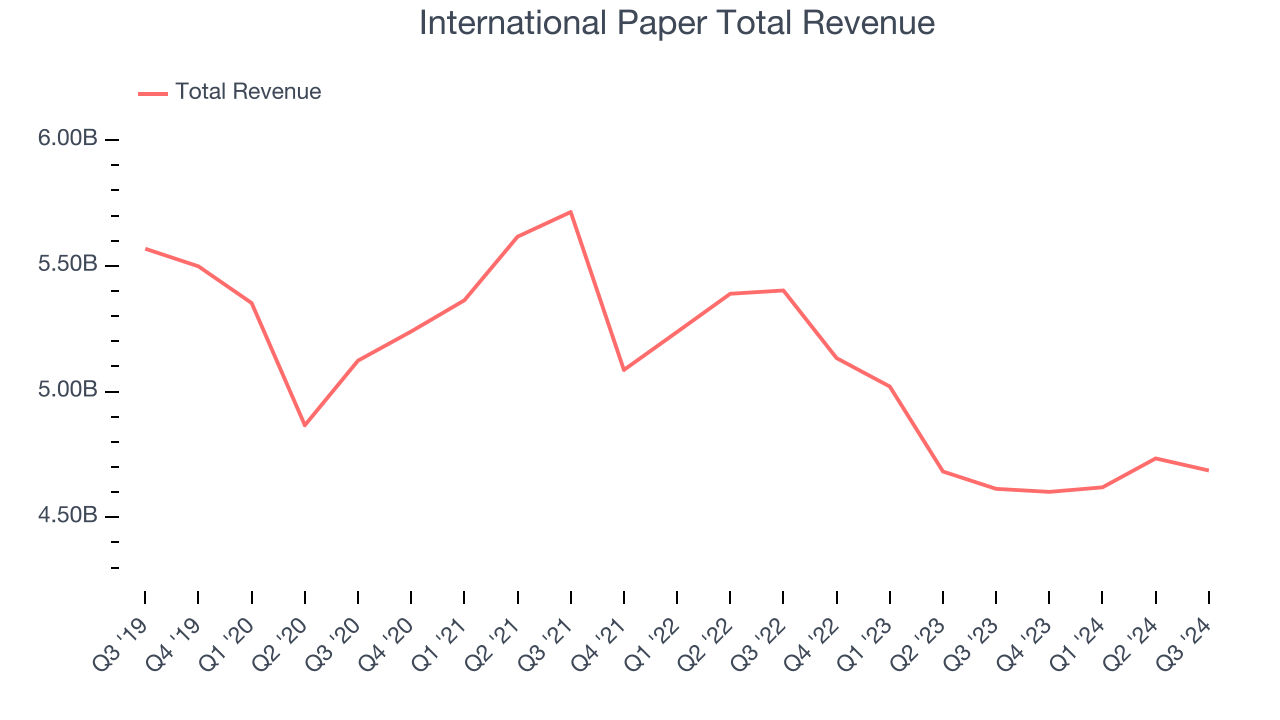
Established in 1898, International Paper (NYSE: IP) produces containerboard, pulp, paper, and materials used in packaging and printing applications.
International Paper reported revenues of $4.69 billion, up 1.6% year on year, in line with analysts’ expectations. The business had an exceptional quarter with an impressive beat of analysts’ EPS estimates and a solid beat of analysts’ EBITDA estimates.
The market seems happy with the results as the stock is up 14.3% since reporting. It currently trades at $56.08.
Is now the time to buy International Paper? Access our full analysis of the earnings results here, it’s free.
Weakest Q3: Silgan Holdings (NYSE: SLGN)
Established in 1987, Silgan Holdings (NYSE: SLGN) is a supplier of rigid packaging for consumer goods products, specializing in metal containers, closures, and plastic packaging.
Silgan Holdings reported revenues of $1.75 billion, down 3.2% year on year, falling short of analysts’ expectations by 4.6%. It was a disappointing quarter as it posted a significant miss of analysts’ adjusted operating income estimates.
Silgan Holdings delivered the weakest performance against analyst estimates in the group. Interestingly, the stock is up 4.7% since the results and currently trades at $53.19.
Read our full analysis of Silgan Holdings’s results here.
Ball (NYSE: BALL)
Started with a $200 loan in 1880, Ball (NYSE: BLL) manufactures aluminum packaging for beverages, personal care, and household products as well as aerospace systems and other technologies.
Ball reported revenues of $3.08 billion, down 13.7% year on year. This number lagged analysts' expectations by 1.6%. Overall, it was a slower quarter as it also logged a miss of analysts’ organic revenue estimates.
Ball had the slowest revenue growth among its peers. The stock is down 3.6% since reporting and currently trades at $61.94.
Read our full, actionable report on Ball here, it’s free.
Crown Holdings (NYSE: CCK)
Formerly Crown Cork & Seal, Crown Holdings (NYSE: CCK) produces packaging products for consumer marketing companies, including food, beverage, household, and industrial products.
Crown Holdings reported revenues of $3.07 billion, flat year on year. This result was in line with analysts’ expectations. Overall, it was a strong quarter as it also recorded an impressive beat of analysts’ adjusted operating income estimates and full-year EPS guidance exceeding analysts’ expectations.
The stock is down 3.5% since reporting and currently trades at $90.59.
Read our full, actionable report on Crown Holdings here, it’s free.
Market Update
In response to the Fed's rate hikes in 2022 and 2023, inflation has been gradually trending down from its post-pandemic peak, trending closer to the Fed's 2% target. Despite higher borrowing costs, the economy has avoided flashing recessionary signals. This is the much-desired soft landing that many investors hoped for. The recent rate cuts (0.5% in September and 0.25% in November 2024) have bolstered the stock market, making 2024 a strong year for equities. Donald Trump’s presidential win in November sparked additional market gains, sending indices to record highs in the days following his victory. However, debates continue over possible tariffs and corporate tax adjustments, raising questions about economic stability in 2025.
Want to invest in winners with rock-solid fundamentals? Check out our Hidden Gem Stocks and add them to your watchlist. These companies are poised for growth regardless of the political or macroeconomic climate.
Join Paid Stock Investor Research
Help us make StockStory more helpful to investors like yourself. Join our paid user research session and receive a $50 Amazon gift card for your opinions. Sign up here.