
Looking back on design software stocks’ Q3 earnings, we examine this quarter’s best and worst performers, including Unity (NYSE: U) and its peers.
The demand for rich, interactive 2D, 3D, VR and AR experiences is growing, and while the ubiquitous metaverse might still be more of a buzzword than a real thing, what is real is the demand for the tools to create these experiences, whether they are games, 3D tours or interactive movies.
The 6 design software stocks we track reported a strong Q3. As a group, revenues beat analysts’ consensus estimates by 4.4% while next quarter’s revenue guidance was 2.9% below.
In light of this news, share prices of the companies have held steady. On average, they are relatively unchanged since the latest earnings results.
Unity (NYSE: U)
Started as a game studio by three friends in a Copenhagen apartment, Unity (NYSE: U) is a software as a service platform that makes it easier to develop and monetize new games and other visual digital experiences.
Unity reported revenues of $446.5 million, down 18% year on year. This print exceeded analysts’ expectations by 4.3%. Overall, it was a mixed quarter for the company with an impressive beat of analysts’ billings estimates but EBITDA guidance for next quarter missing analysts’ expectations.
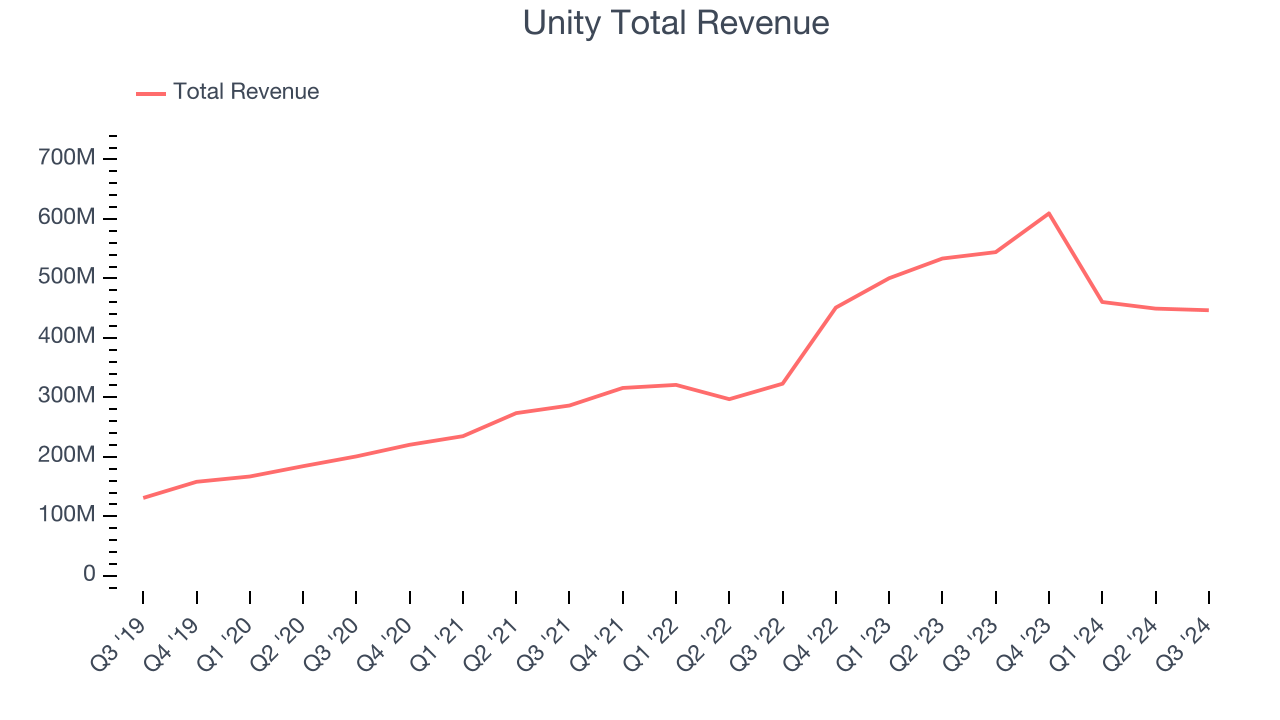
Unity delivered the slowest revenue growth and weakest full-year guidance update of the whole group. Unsurprisingly, the stock is down 16.2% since reporting and currently trades at $18.64.
Is now the time to buy Unity? Access our full analysis of the earnings results here, it’s free.
Best Q3: ANSYS (NASDAQ: ANSS)
Used to help design the Mars Rover, Ansys (NASDAQ: ANSS) offers a software-as-a-service platform that enables simulation for engineering and design.
ANSYS reported revenues of $601.9 million, up 31.2% year on year, outperforming analysts’ expectations by 14.9%. The business had a stunning quarter with an impressive beat of analysts’ EBITDA estimates and a solid beat of analysts’ annual contract value estimates.
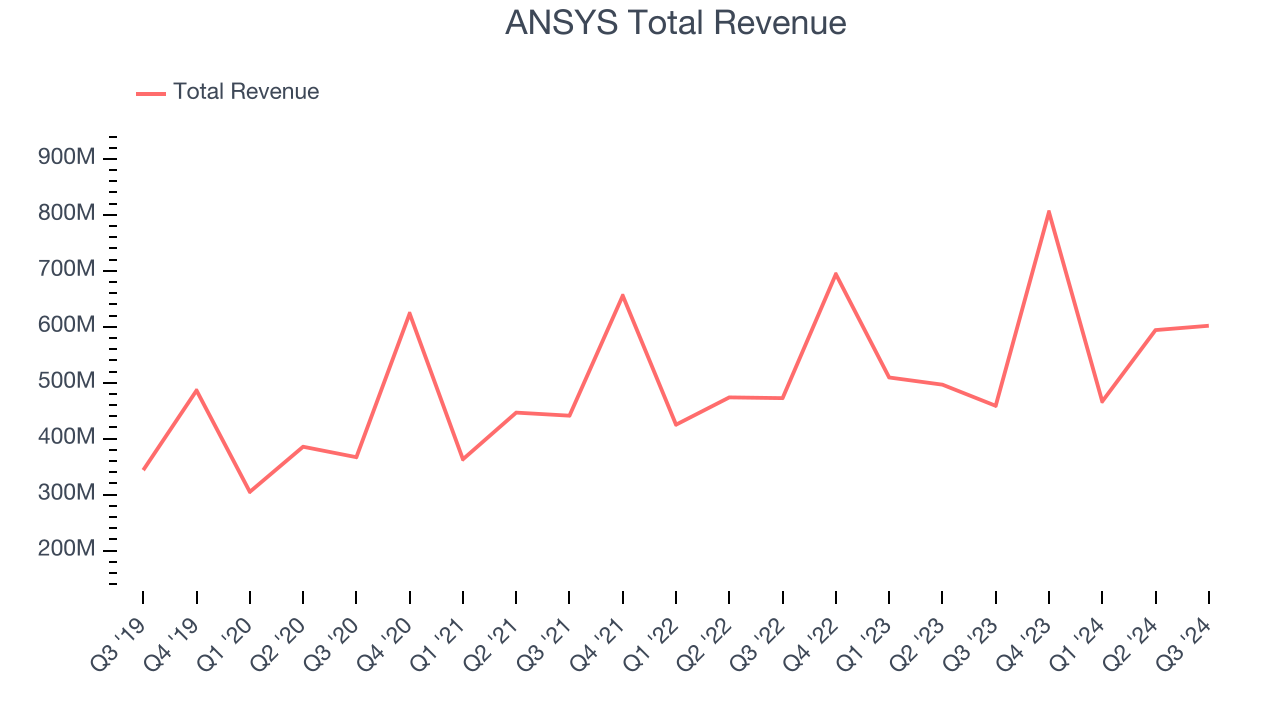
ANSYS pulled off the biggest analyst estimates beat and fastest revenue growth among its peers. The market seems content with the results as the stock is up 2% since reporting. It currently trades at $339.99.
Is now the time to buy ANSYS? Access our full analysis of the earnings results here, it’s free.
Weakest Q3: Adobe (NASDAQ: ADBE)
One of the most well-known Silicon Valley software companies around, Adobe (NASDAQ: ADBE) is a leading provider of software as service in the digital design and document management space.
Adobe reported revenues of $5.41 billion, up 10.6% year on year, exceeding analysts’ expectations by 0.6%. Still, it was a slower quarter as it posted revenue guidance for next quarter slightly missing analysts’ expectations.
Adobe delivered the weakest performance against analyst estimates in the group. As expected, the stock is down 10.4% since the results and currently trades at $526.10.
Read our full analysis of Adobe’s results here.
Cadence (NASDAQ: CDNS)
With the name chosen to reflect the idea of a repeating pattern or rhythm in electronic design, Cadence Design Systems (NASDAQ: CDNS) offers a software-as-a-service platform for semiconductor engineering and design.
Cadence reported revenues of $1.22 billion, up 18.8% year on year. This print topped analysts’ expectations by 2.9%. Overall, it was a very strong quarter as it also produced a solid beat of analysts’ billings estimates and an impressive beat of analysts’ EBITDA estimates.
The stock is up 18.2% since reporting and currently trades at $298.77.
Read our full, actionable report on Cadence here, it’s free.
Procore (NYSE: PCOR)
Used to manage the multi-year expansion of the Panama Canal that began in 2007, Procore (NYSE: PCOR) offers a software-as-service project, finance, and quality management platform for the construction industry.
Procore reported revenues of $295.9 million, up 19.4% year on year. This print topped analysts’ expectations by 2.9%. It was a strong quarter as it also produced an impressive beat of analysts’ EBITDA estimates and accelerating customer growth.
Procore scored the highest full-year guidance raise among its peers. The company added 225 customers to reach a total of 16,975. The stock is up 14.3% since reporting and currently trades at $71.61.
Read our full, actionable report on Procore here, it’s free.
Market Update
The Fed’s interest rate hikes throughout 2022 and 2023 have successfully cooled post-pandemic inflation, bringing it closer to the 2% target. Inflationary pressures have eased without tipping the economy into a recession, suggesting a soft landing. This stability, paired with recent rate cuts (0.5% in September 2024 and 0.25% in November 2024), has fueled a strong year for the stock market in 2024. The markets surged further after Donald Trump’s presidential victory in November, with major indices reaching record highs in the days following the election. Still, questions remain about the direction of economic policy, as potential tariffs and corporate tax changes add uncertainty heading into 2025.
Want to invest in winners with rock-solid fundamentals? Check out our 9 Best Market-Beating Stocks and add them to your watchlist. These companies are poised for growth regardless of the political or macroeconomic climate.
Join Paid Stock Investor Research
Help us make StockStory more helpful to investors like yourself. Join our paid user research session and receive a $50 Amazon gift card for your opinions. Sign up here.


