
Over the past six months, Five9’s stock price has fallen to $40.89. Shareholders have lost 16.2% of their capital, highly disappointing when considering the S&P 500 has climbed 13.4%. This might have investors contemplating their next move.
Is there a buying opportunity in Five9, or does it present a risk to your portfolio? Dive into our full research report to see our analyst team’s opinion, it’s free.Despite the more favorable entry price, we're sitting this one out for now. Here are three reasons why FIVN doesn't excite us and one stock we'd rather own today.
Why Is Five9 Not Exciting?
Started in 2001, Five9 (NASDAQ: FIVN) offers software as a service that makes it easier for companies to set up and efficiently run call centers, and offer more tailored customer support.
1. Projected Revenue Growth Is Slim
Forecasted revenues by Wall Street analysts signal a company’s potential. Predictions may not always be accurate, but accelerating growth typically boosts valuation multiples and stock prices while slowing growth does the opposite.Over the next 12 months, sell-side analysts expect Five9’s revenue to rise by 9.4%, a deceleration versus its 21.1% annualized growth for the past three years. This projection doesn't excite us and implies its products and services will see some demand headwinds.
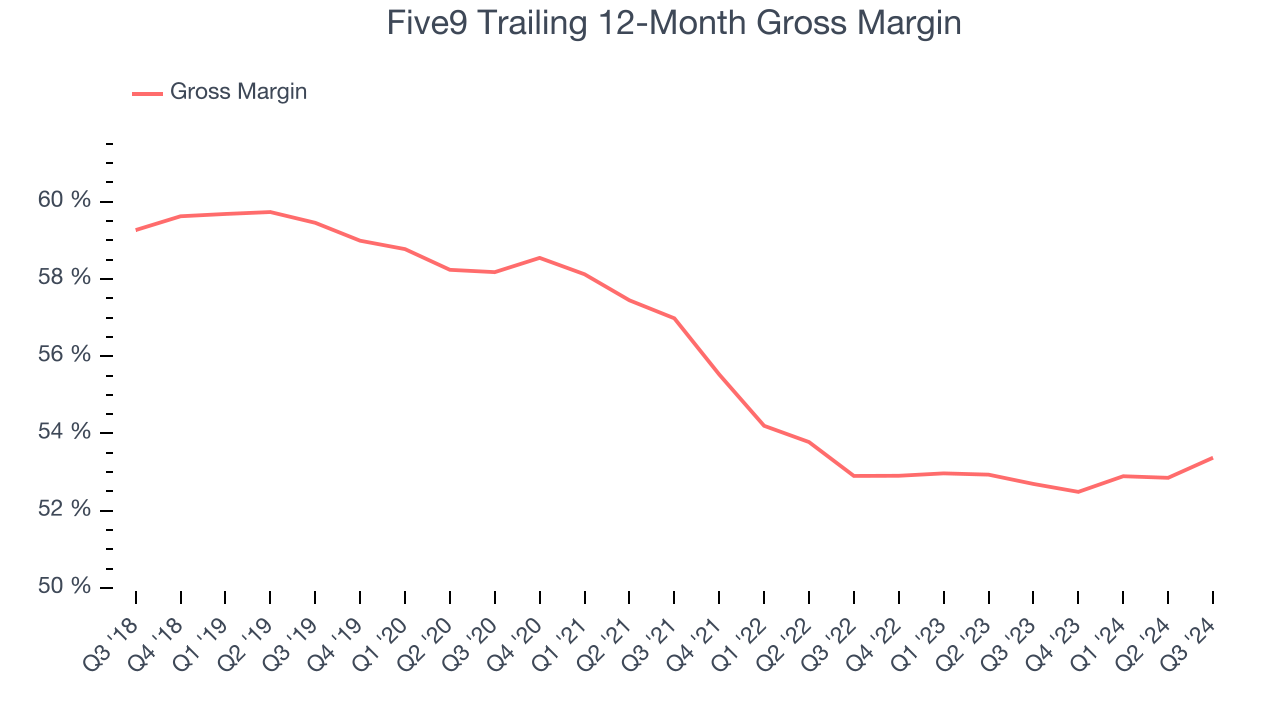
2. Low Gross Margin Reveals Weak Structural Profitability
For software companies like Five9, gross profit tells us how much money remains after paying for the base cost of products and services (typically servers, licenses, and certain personnel). These costs are usually low as a percentage of revenue, explaining why software is more competitive than other industries.
Five9’s gross margin is substantially worse than most software businesses, signaling it has relatively high infrastructure costs compared to an asset-lite business like ServiceNow. As you can see below, it averaged a 53.4% gross margin over the last year. Said differently, Five9 had to pay a chunky $46.63 to its service providers for every $100 in revenue.
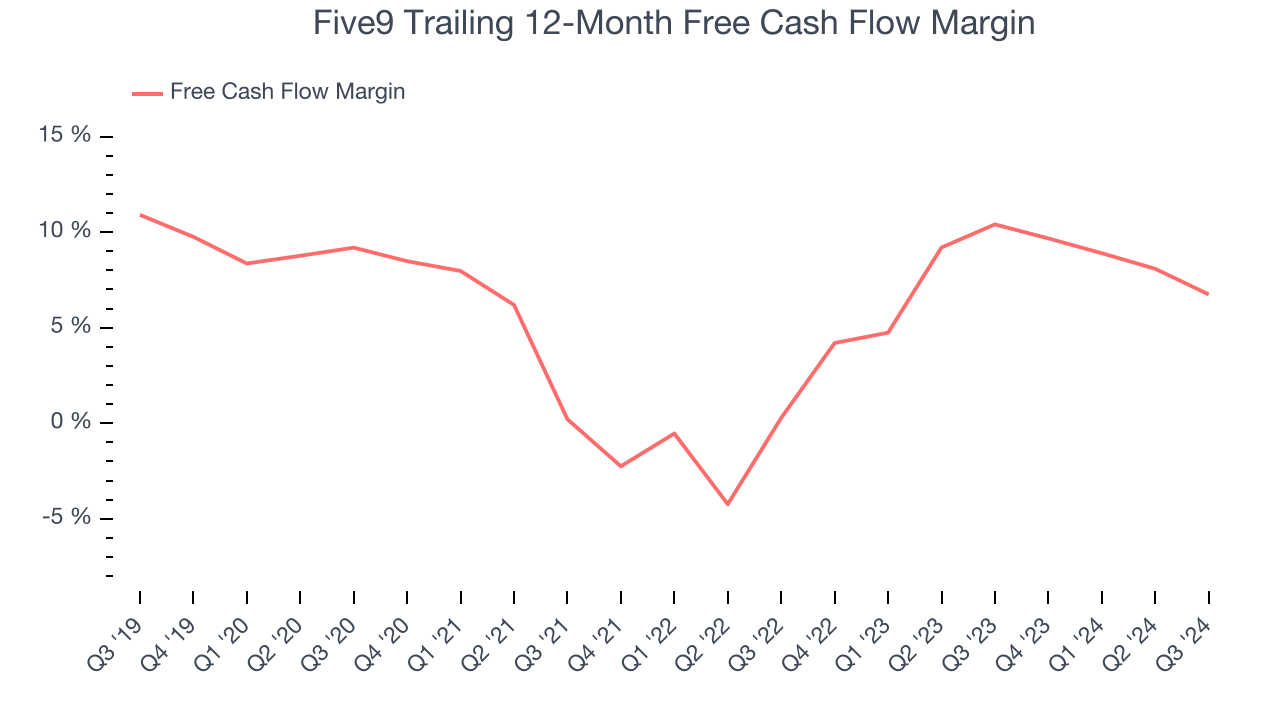
3. Mediocre Free Cash Flow Limits Reinvestment Potential
If you’ve followed StockStory for a while, you know we emphasize free cash flow. Why, you ask? We believe that in the end, cash is king, and you can’t use accounting profits to pay the bills.
Five9 has shown mediocre cash profitability over the last year, giving the company limited opportunities to return capital to shareholders. Its free cash flow margin averaged 6.7%, subpar for a software business.
Final Judgment
Five9 isn’t a terrible business, but it doesn’t pass our bar. After the recent drawdown, the stock trades at 2.8x forward price-to-sales (or $40.89 per share). This valuation is reasonable, but the company’s shakier fundamentals present too much downside risk. We're fairly confident there are better stocks to buy right now. We’d recommend taking a look at Cloudflare, one of our top software picks that could be a home run with edge computing.
Stocks We Would Buy Instead of Five9
The Trump trade may have passed, but rates are still dropping and inflation is still cooling. Opportunities are ripe for those ready to act - and we’re here to help you pick them.
Get started by checking out our Top 6 Stocks for this week. This is a curated list of our High Quality stocks that have generated a market-beating return of 175% over the last five years.
Stocks that made our list in 2019 include now familiar names such as Nvidia (+2,691% between September 2019 and September 2024) as well as under-the-radar businesses like Comfort Systems (+783% five-year return). Find your next big winner with StockStory today for free.