Business communications software company 8x8 (NYSE: EGHT) reported revenue ahead of Wall Street’s expectations in Q3 CY2024, but sales fell 2.2% year on year to $181 million. On the other hand, next quarter’s revenue guidance of $172.5 million was less impressive, coming in 4.9% below analysts’ estimates. Its non-GAAP profit of $0.09 per share was also 13% above analysts’ consensus estimates.
Is now the time to buy 8x8? Find out by accessing our full research report, it’s free.
8x8 (EGHT) Q3 CY2024 Highlights:
- Revenue: $181 million vs analyst estimates of $178.3 million (1.5% beat)
- Adjusted EPS: $0.09 vs analyst estimates of $0.08 (13% beat)
- EBITDA: $26.65 million vs analyst estimates of $23.73 million (12.3% beat)
- The company reconfirmed its revenue guidance for the full year of $720.5 million at the midpoint
- Gross Margin (GAAP): 68.1%, down from 69.1% in the same quarter last year
- EBITDA Margin: 14.7%, down from 16.5% in the same quarter last year
- Free Cash Flow Margin: 4.6%, down from 8.3% in the previous quarter
- Billings: $184.6 million at quarter end, up 3.5% year on year
- Market Capitalization: $282.3 million
"We are pleased to report a solid quarter, with results that reflect the early signs of success of our investments in innovation and our transformation strategy," said Samuel Wilson, Chief Executive Officer at 8x8, Inc.
Company Overview
Founded in 1987, 8x8 (NYSE: EGHT) provides software for organizations to efficiently communicate and collaborate with their customers, employees, and partners.
Video Conferencing
Work is becoming more distributed, both across geographies and devices. In order for businesses to keep functioning efficiently, they need to be able to communicate as well as they did when the teams were co-located, which drives the demand for integrated communication platforms.
Sales Growth
A company’s long-term performance is an indicator of its overall business quality. While any business can experience short-term success, top-performing ones enjoy sustained growth for multiple years. Unfortunately, 8x8’s 7.4% annualized revenue growth over the last three years was weak. This shows it failed to expand in any major way, a rough starting point for our analysis.
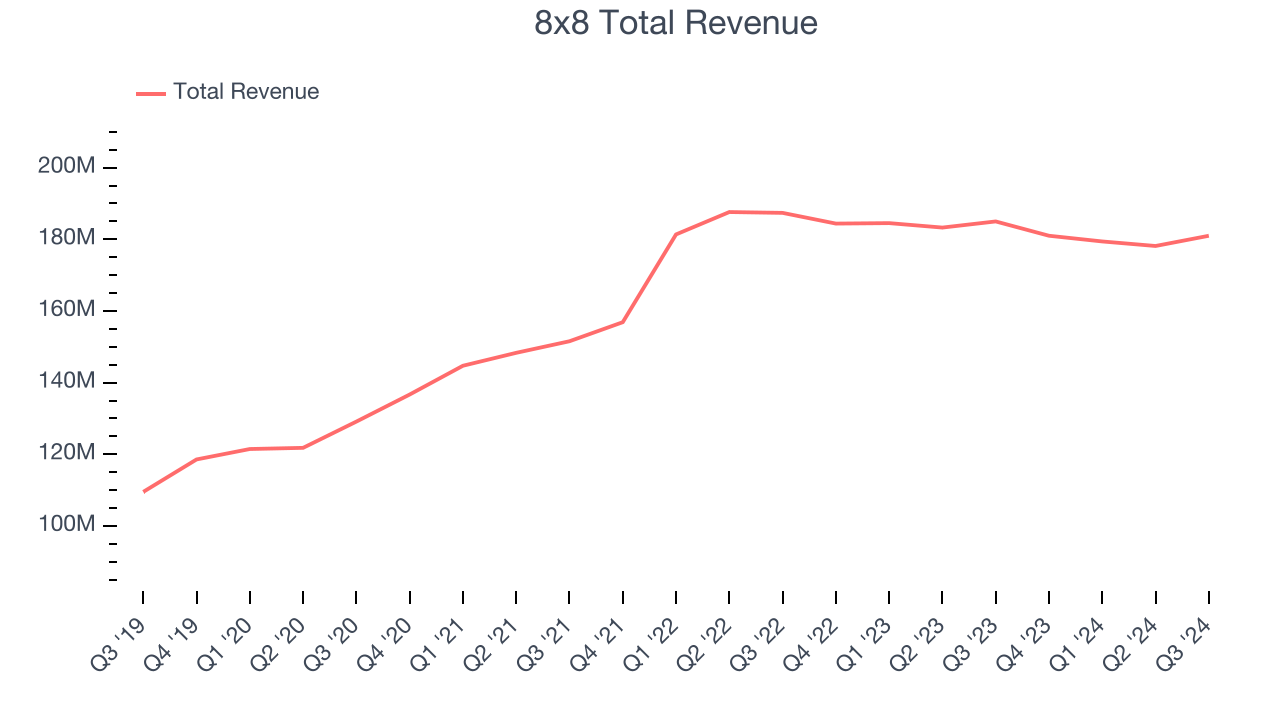
This quarter, 8x8’s revenue fell 2.2% year on year to $181 million but beat Wall Street’s estimates by 1.5%. Management is currently guiding for a 4.7% year-on-year decline next quarter.
Looking further ahead, sell-side analysts expect revenue to remain flat over the next 12 months, a deceleration versus the last three years. This projection is underwhelming and illustrates the market believes its products and services will see some demand headwinds.
When a company has more cash than it knows what to do with, buying back its own shares can make a lot of sense–as long as the price is right. Luckily, we’ve found one, a low-priced stock that is gushing free cash flow AND buying back shares. Click here to claim your Special Free Report on a fallen angel growth story that is already recovering from a setback.
Billings
In addition to revenue, billings is a non-GAAP metric that sheds additional light on 8x8’s business quality. Billings is often called “cash revenue” because it shows how much money the company has collected from customers in a certain period. This is different from revenue, which must be recognized in pieces over the length of a contract.
Over the last year, 8x8’s billings averaged 2% year-on-year declines and fell to $184.6 million in the latest quarter. This performance mirrored its revenue and shows the company faced challenges in acquiring and retaining customers. It also suggests there may be increasing competition or market saturation. If 8x8 wants to accelerate billings growth, it must enhance its offerings and marketing strategies. 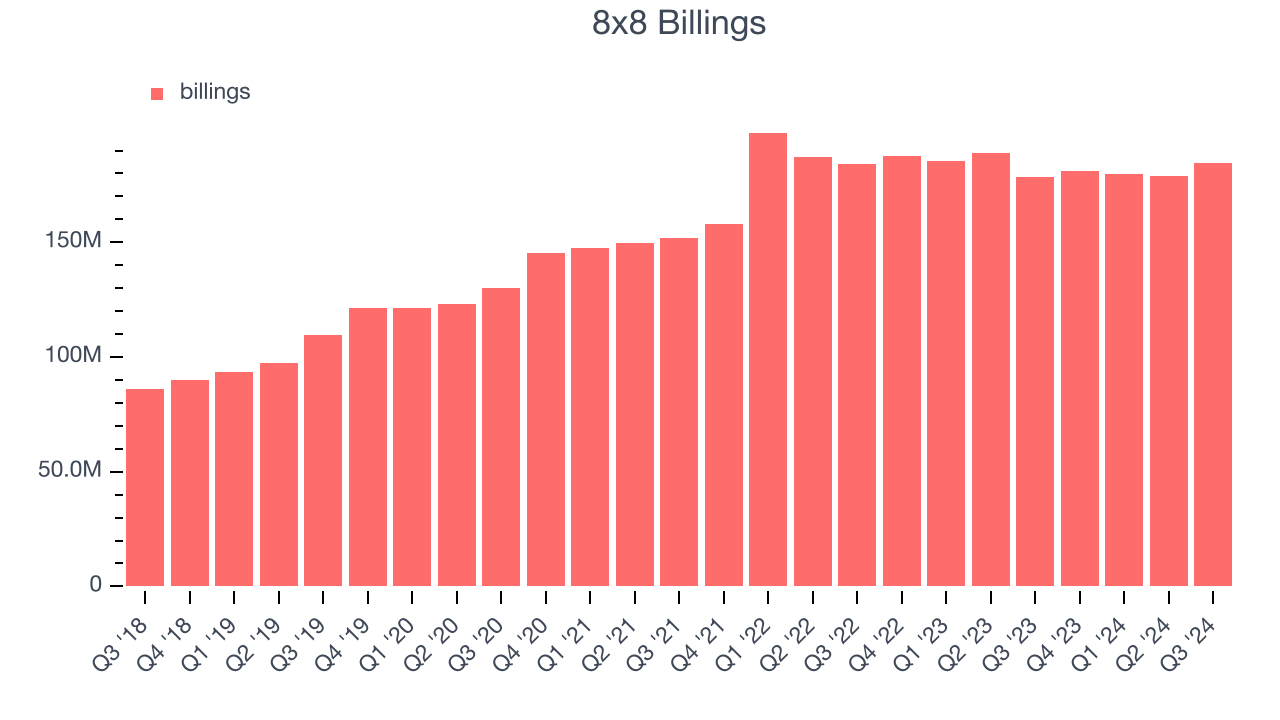
Customer Acquisition Efficiency
Customer acquisition cost (CAC) payback represents the months required to recover the cost of acquiring a new customer. Essentially, it’s the break-even point for marketing and sales investments. A shorter CAC payback period is ideal, as it implies better returns on investment and business scalability.
It’s very expensive for 8x8 to acquire new customers as its CAC payback period checked in at -98.1 months this quarter. The company’s inefficiency indicates a highly competitive environment with little differentiation between 8x8’s products and its peers.
Key Takeaways from 8x8’s Q3 Results
We were impressed by how significantly 8x8 blew past analysts’ EBITDA expectations this quarter. We were also excited its billings outperformed Wall Street’s estimates. On the other hand, its revenue guidance for next quarter missed analysts’ expectations, but the market seems willing to overlook this. Overall, this quarter had some key positives. The stock traded up 5.6% to $2.45 immediately following the results.
So should you invest in 8x8 right now? We think that the latest quarter is only one piece of the longer-term business quality puzzle. Quality, when combined with valuation, can help determine if the stock is a buy. We cover that in our actionable full research report which you can read here, it’s free.