Bedding and comfort retailer Purple (NASDAQ: PRPL) fell short of the market’s revenue expectations in Q3 CY2024, with sales falling 15.3% year on year to $118.6 million. On the other hand, the company’s outlook for the full year was close to analysts’ estimates with revenue guided to $500 million at the midpoint. Its GAAP loss of $0.36 per share was also 344% below analysts’ consensus estimates.
Is now the time to buy Purple? Find out by accessing our full research report, it’s free.
Purple (PRPL) Q3 CY2024 Highlights:
- Revenue: $118.6 million vs analyst estimates of $126.6 million (6.3% miss)
- EPS: -$0.36 vs analyst estimates of -$0.08 (-$0.28 miss)
- EBITDA: -$6.38 million vs analyst estimates of -$3.71 million (71.8% miss)
- The company reconfirmed its revenue guidance for the full year of $500 million at the midpoint
- EBITDA guidance for the full year is -$15 million at the midpoint, above analyst estimates of -$18.66 million
- Gross Margin (GAAP): 29.7%, down from 33.8% in the same quarter last year
- Operating Margin: -39.5%, down from -23.3% in the same quarter last year
- EBITDA Margin: -5.4%, up from -11.6% in the same quarter last year
- Free Cash Flow was $101,000, up from -$21.08 million in the same quarter last year
- Market Capitalization: $97.82 million
"While our third quarter revenue was challenged, we are encouraged by both our year-to-date performance modestly exceeding the broader industry and the sustained improvements in our profitability," said CEO Rob DeMartini.
Company Overview
Founded by two brothers, Purple (NASDAQ: PRPL) creates sleep and home comfort products such as mattresses, pillows, and bedding accessories.
Home Furnishings
A healthy housing market is good for furniture demand as more consumers are buying, renting, moving, and renovating. On the other hand, periods of economic weakness or high interest rates discourage home sales and can squelch demand. In addition, home furnishing companies must contend with shifting consumer preferences such as the growing propensity to buy goods online, including big things like mattresses and sofas that were once thought to be immune from e-commerce competition.
Sales Growth
A company’s long-term performance can indicate its business quality. Any business can put up a good quarter or two, but many enduring ones grow for years. Regrettably, Purple’s sales grew at a sluggish 5.7% compounded annual growth rate over the last five years. This shows it failed to expand in any major way, a rough starting point for our analysis.
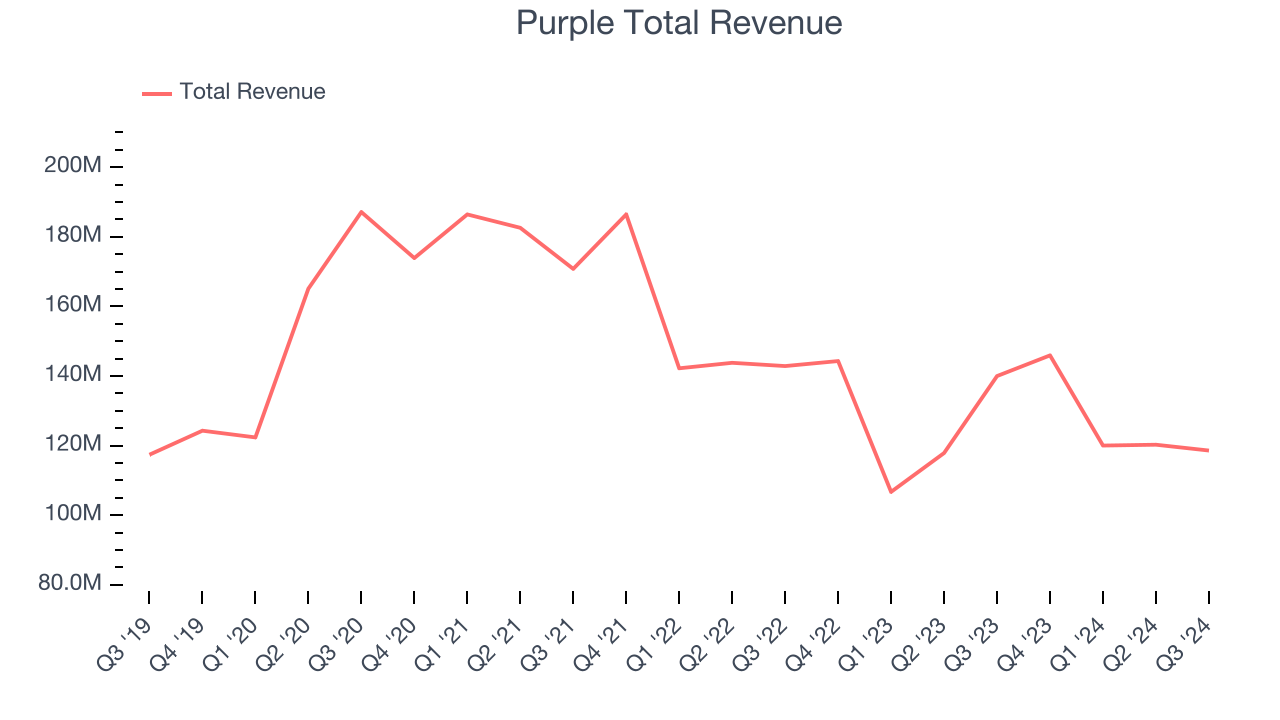
We at StockStory place the most emphasis on long-term growth, but within consumer discretionary, a stretched historical view may miss a company riding a successful new product or emerging trend. Purple’s history shows it grew in the past but relinquished its gains over the last two years, as its revenue fell by 9.4% annually. 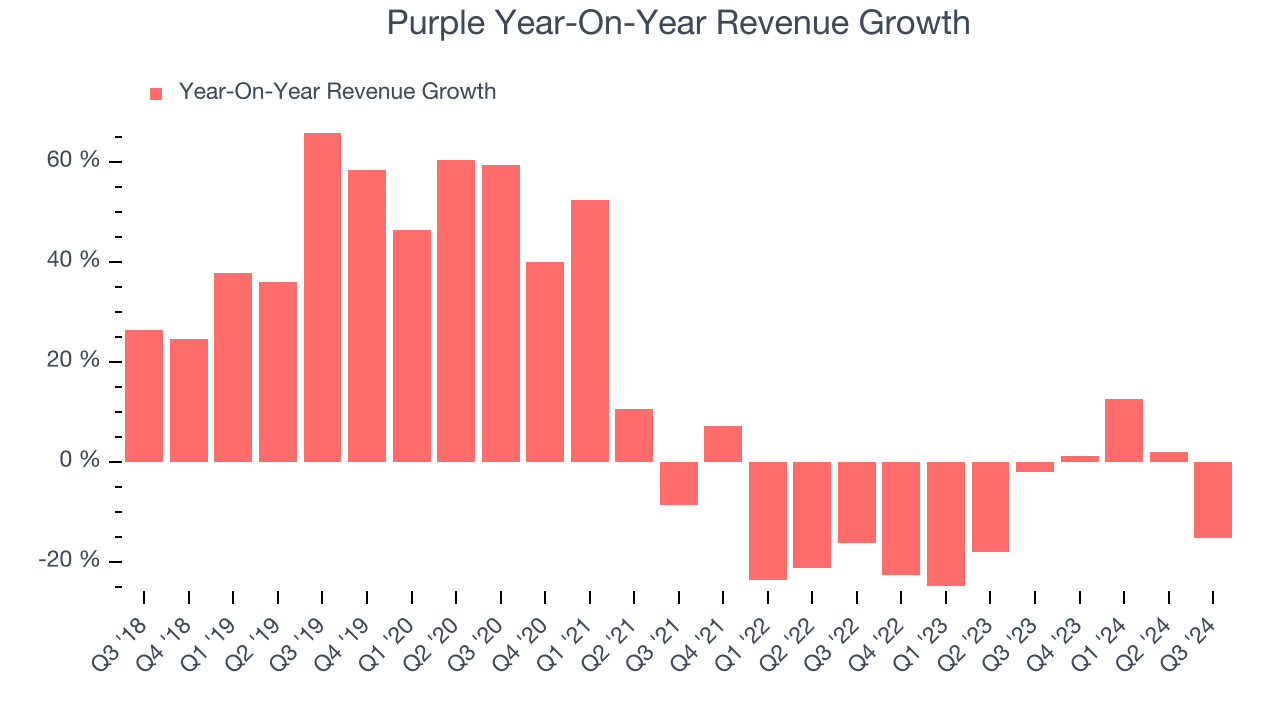
This quarter, Purple missed Wall Street’s estimates and reported a rather uninspiring 15.3% year-on-year revenue decline, generating $118.6 million of revenue.
Looking ahead, sell-side analysts expect revenue to grow 2.9% over the next 12 months, an improvement versus the last two years. Although this projection indicates the market thinks its newer products and services will catalyze better performance, it is still below average for the sector.
Here at StockStory, we certainly understand the potential of thematic investing. Diverse winners from Microsoft (MSFT) to Alphabet (GOOG), Coca-Cola (KO) to Monster Beverage (MNST) could all have been identified as promising growth stories with a megatrend driving the growth. So, in that spirit, we’ve identified a relatively under-the-radar profitable growth stock benefitting from the rise of AI, available to you FREE via this link.
Cash Is King
If you’ve followed StockStory for a while, you know we emphasize free cash flow. Why, you ask? We believe that in the end, cash is king, and you can’t use accounting profits to pay the bills.
While Purple’s free cash flow broke even this quarter, the broader story hasn’t been so clean. Over the last two years, Purple’s demanding reinvestments to stay relevant have drained its resources. Its free cash flow margin averaged negative 10.1%, meaning it lit $10.07 of cash on fire for every $100 in revenue.
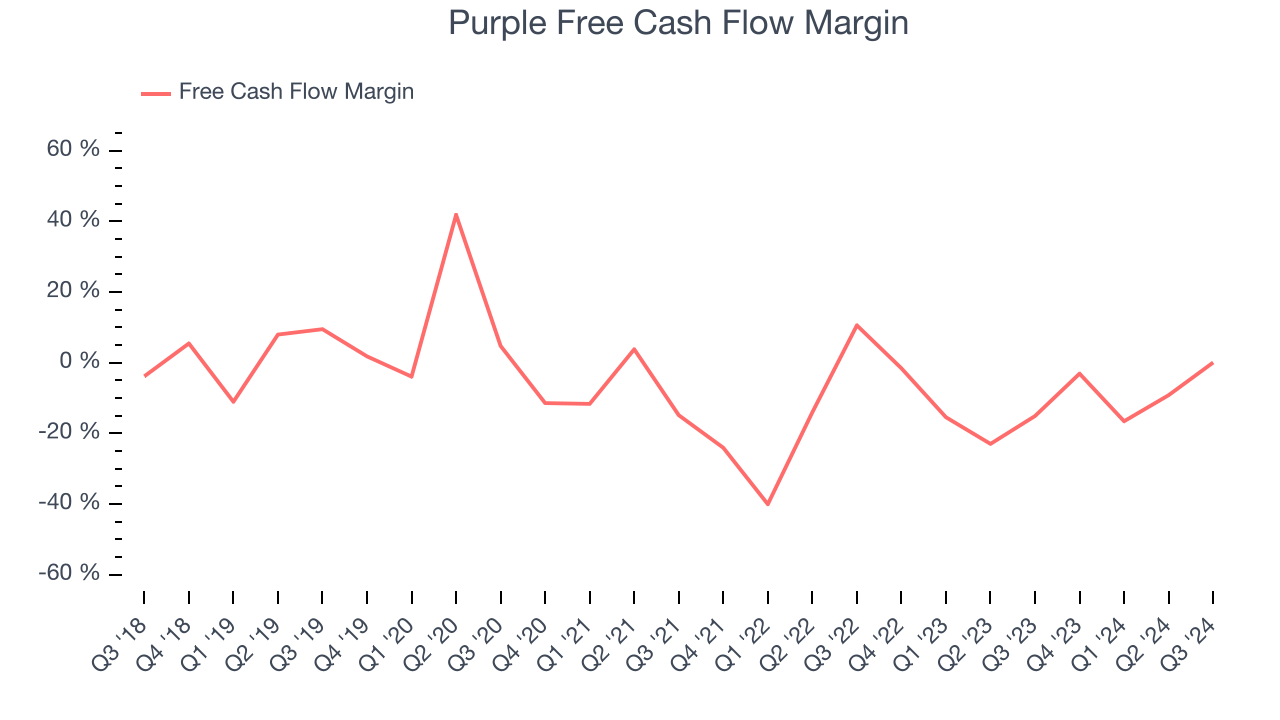
Purple broke even from a free cash flow perspective in Q3. This result was good as its margin was 15.1 percentage points higher than in the same quarter last year, but we wouldn’t read too much into the short term because investment needs can be seasonal, causing temporary swings. Long-term trends are more important.
Over the next year, analysts predict Purple will continue burning cash, albeit to a lesser extent. Their consensus estimates imply its free cash flow margin of negative 7% for the last 12 months will increase to negative 4.7%.
Key Takeaways from Purple’s Q3 Results
We were impressed by Purple’s optimistic full-year EBITDA forecast, which blew past analysts’ expectations. On the other hand, its revenue missed and its EBITDA fell short of Wall Street’s estimates. Overall, this quarter could have been better. The stock traded down 3.2% to $0.91 immediately following the results.
Purple may have had a tough quarter, but does that actually create an opportunity to invest right now? If you’re making that decision, you should consider the bigger picture of valuation, business qualities, as well as the latest earnings. We cover that in our actionable full research report which you can read here, it’s free.