Construction equipment company Astec (NASDAQ: ASTE) fell short of the market’s revenue expectations in Q3 CY2024, with sales falling 3.9% year on year to $291.4 million. Its non-GAAP profit of $0.31 per share was in line with analysts’ consensus estimates.
Is now the time to buy Astec? Find out by accessing our full research report, it’s free.
Astec (ASTE) Q3 CY2024 Highlights:
- Revenue: $291.4 million vs analyst estimates of $312.9 million (6.9% miss)
- Adjusted EPS: $0.31 vs analyst expectations of $0.31 (in line)
- EBITDA: $17.4 million vs analyst estimates of $16.6 million (4.8% beat)
- Gross Margin (GAAP): 22.9%, in line with the same quarter last year
- Operating Margin: -2.5%, in line with the same quarter last year
- EBITDA Margin: 6%, up from 0.6% in the same quarter last year
- Free Cash Flow was $19.9 million, up from -$24.2 million in the same quarter last year
- Market Capitalization: $758.8 million
"In the third quarter, we had mixed results. In Infrastructure Solutions, both sales and margins were up for the quarter, while in Materials Solutions, we continued to face difficult market conditions. We made nice progress improving our cash flow in the third quarter, which continues to be a key focal point. We were also able to settle one of our previously disclosed, long-standing, legacy litigation matters related to a product we no longer own, which resulted in an $8.4 million charge in the third quarter," said Jaco van der Merwe, Chief Executive Officer.
Company Overview
Inventing the first ever double-barrel hot-mix asphalt plant, Astec (NASDAQ: ASTE) provides machines and equipment for building roads, processing raw materials, and producing concrete.
Construction Machinery
Automation that increases efficiencies and connected equipment that collects analyzable data have been trending, creating new sales opportunities for construction machinery companies. On the other hand, construction machinery companies are at the whim of economic cycles. Interest rates, for example, can greatly impact the commercial and residential construction that drives demand for these companies’ offerings.
Sales Growth
A company’s long-term performance is an indicator of its overall business quality. While any business can experience short-term success, top-performing ones enjoy sustained growth for multiple years. Unfortunately, Astec’s 1.3% annualized revenue growth over the last five years was weak. This shows it failed to expand in any major way, a rough starting point for our analysis.
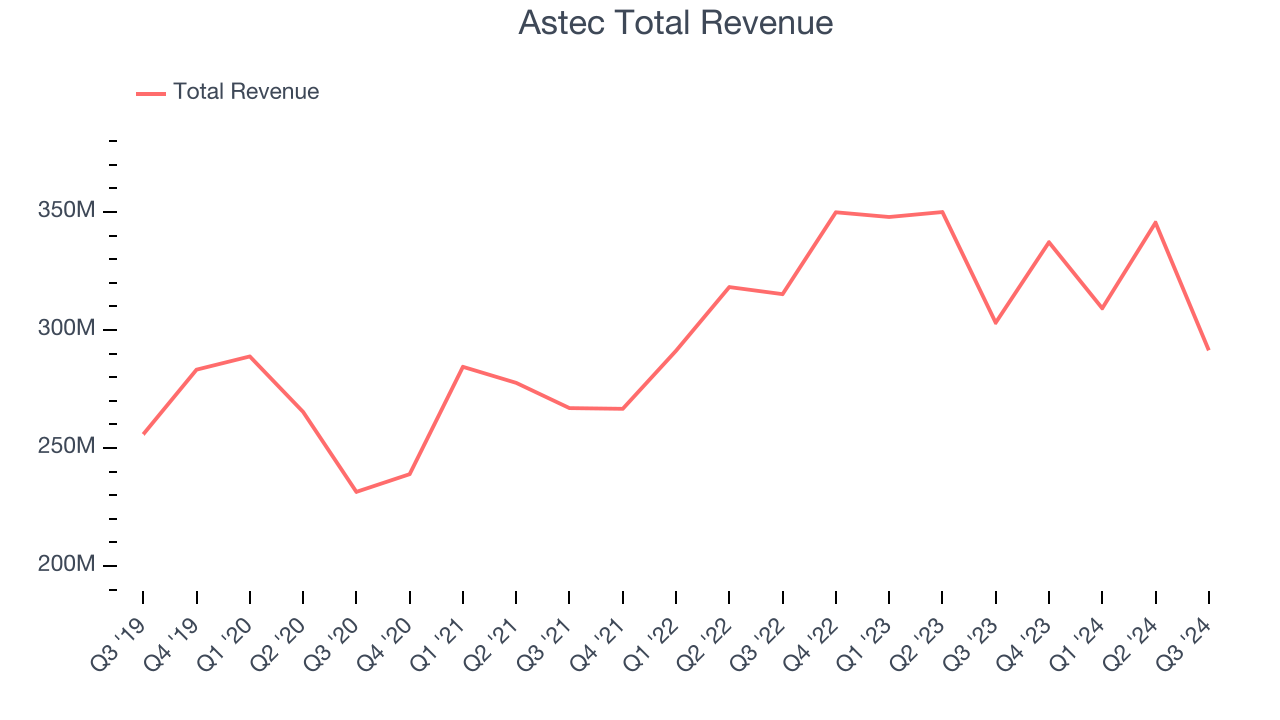
We at StockStory place the most emphasis on long-term growth, but within industrials, a half-decade historical view may miss cycles, industry trends, or a company capitalizing on catalysts such as a new contract win or a successful product line. Astec’s annualized revenue growth of 3.8% over the last two years is above its five-year trend, but we were still disappointed by the results. 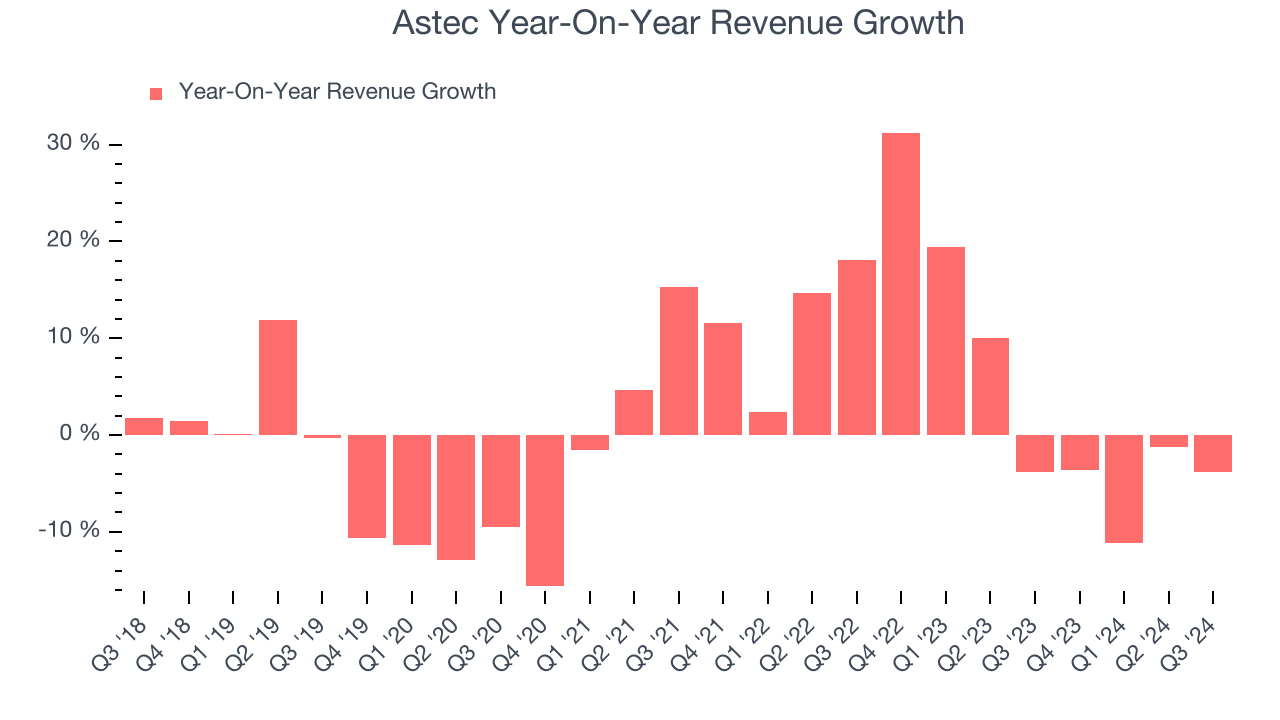
This quarter, Astec missed Wall Street’s estimates and reported a rather uninspiring 3.9% year-on-year revenue decline, generating $291.4 million of revenue.
Looking ahead, sell-side analysts expect revenue to grow 6.3% over the next 12 months, an improvement versus the last two years. While this projection illustrates the market believes its newer products and services will fuel better performance, it is still below average for the sector.
Unless you’ve been living under a rock, it should be obvious by now that generative AI is going to have a huge impact on how large corporations do business. While Nvidia and AMD are trading close to all-time highs, we prefer a lesser-known (but still profitable) semiconductor stock benefitting from the rise of AI. Click here to access our free report on our favorite semiconductor growth story.
Operating Margin
Operating margin is a key measure of profitability. Think of it as net income–the bottom line–excluding the impact of taxes and interest on debt, which are less connected to business fundamentals.
Astec was profitable over the last five years but held back by its large cost base. Its average operating margin of 1.9% was weak for an industrials business. This result isn’t too surprising given its low gross margin as a starting point.
On the plus side, Astec’s annual operating margin rose by 3.3 percentage points over the last five years.
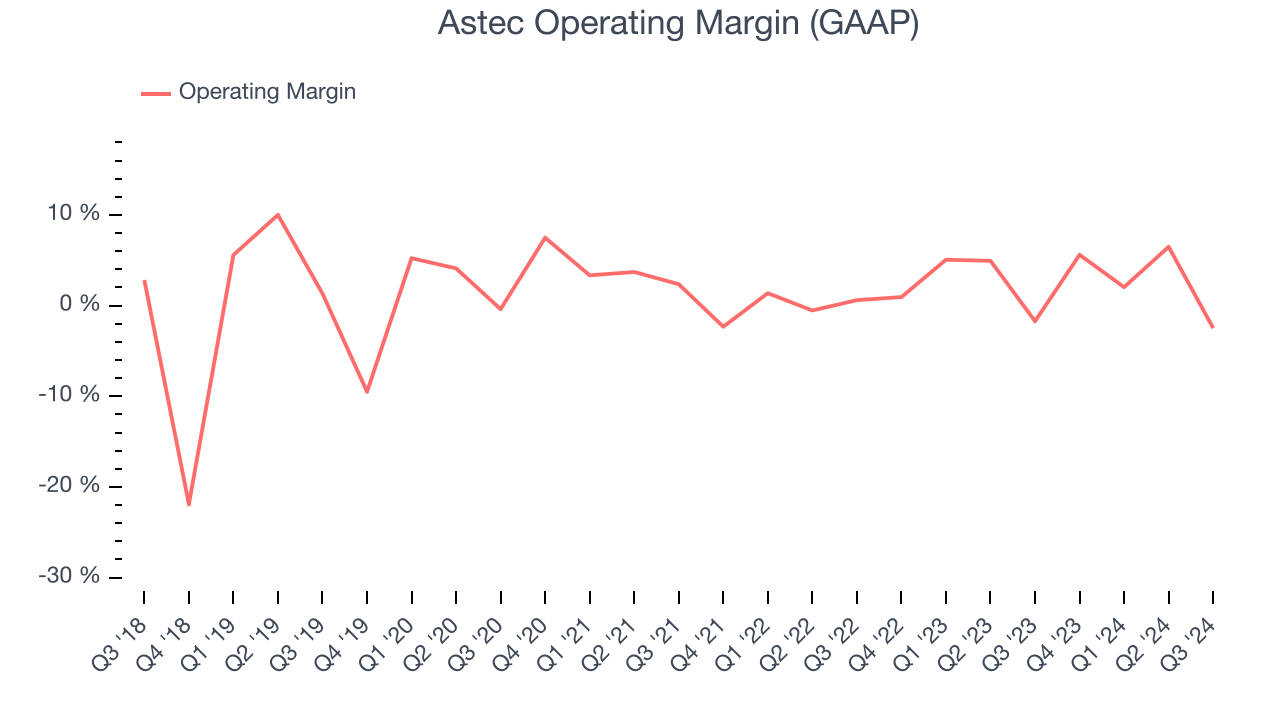
In Q3, Astec generated an operating profit margin of negative 2.5%, in line with the same quarter last year. This indicates the company’s cost structure has recently been stable.
Earnings Per Share
Analyzing revenue trends tells us about a company’s historical growth, but the long-term change in its earnings per share (EPS) points to the profitability of that growth – for example, a company could inflate its sales through excessive spending on advertising and promotions.
Astec’s EPS grew at a weak 3.7% compounded annual growth rate over the last five years. On the bright side, this performance was better than its 1.3% annualized revenue growth and tells us the company became more profitable as it expanded.
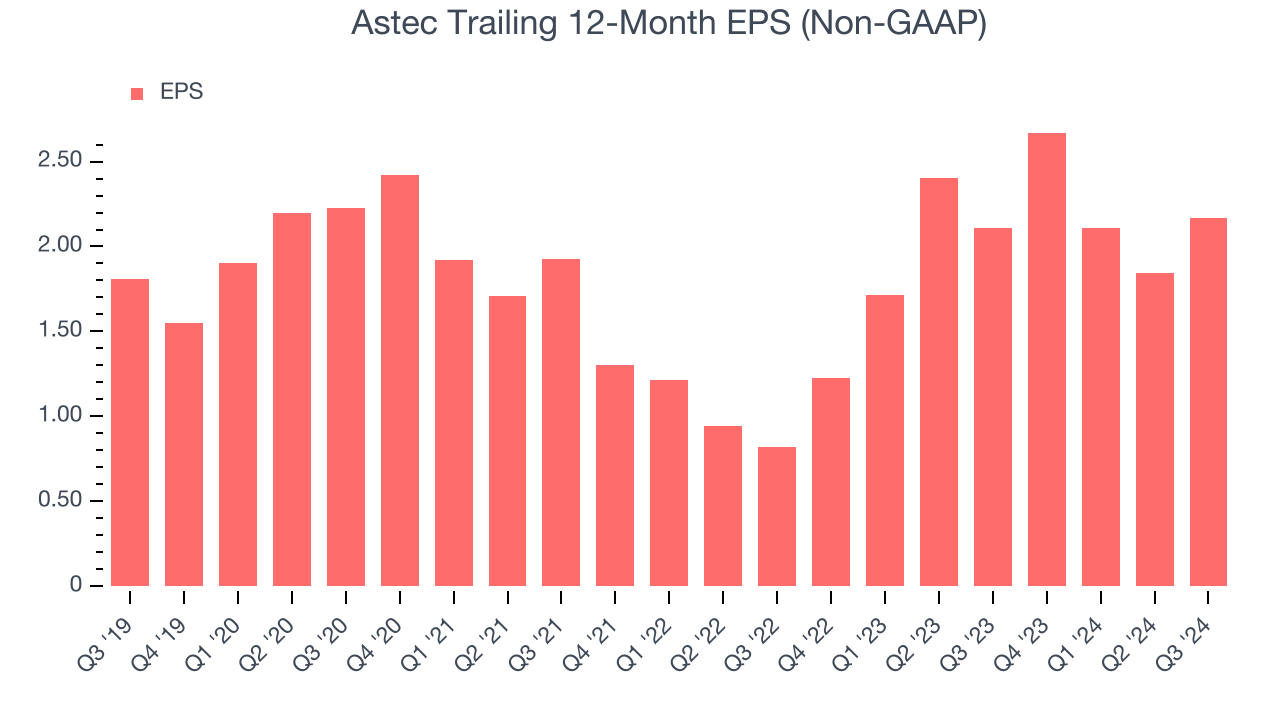
Diving into the nuances of Astec’s earnings can give us a better understanding of its performance. As we mentioned earlier, Astec’s operating margin was flat this quarter but expanded by 3.3 percentage points over the last five years. This was the most relevant factor (aside from the revenue impact) behind its higher earnings; taxes and interest expenses can also affect EPS but don’t tell us as much about a company’s fundamentals.
Like with revenue, we analyze EPS over a shorter period to see if we are missing a change in the business.
For Astec, its two-year annual EPS growth of 62.4% was higher than its five-year trend. This acceleration made it one of the faster-growing industrials companies in recent history.In Q3, Astec reported EPS at $0.31, up from negative $0.01 in the same quarter last year. This print was close to analysts’ estimates. Over the next 12 months, Wall Street expects Astec’s full-year EPS of $2.17 to grow by 12.2%.
Key Takeaways from Astec’s Q3 Results
We enjoyed seeing Astec exceed analysts’ EBITDA expectations this quarter. On the other hand, its revenue missed. Overall, this was a mixed quarter. The stock remained flat at $33.30 immediately after reporting.
Astec’s latest earnings report disappointed. One quarter doesn’t define a company’s quality, so let’s explore whether the stock is a buy at the current price. We think that the latest quarter is only one piece of the longer-term business quality puzzle. Quality, when combined with valuation, can help determine if the stock is a buy. We cover that in our actionable full research report which you can read here, it’s free.