Geospatial technology provider Trimble (NASDAQ: TRMB) beat Wall Street’s revenue expectations in Q3 CY2024, but sales fell 8.5% year on year to $875.8 million. The company expects next quarter’s revenue to be around $945 million, close to analysts’ estimates. Its non-GAAP profit of $0.70 per share was also 13.3% above analysts’ consensus estimates.
Is now the time to buy Trimble? Find out by accessing our full research report, it’s free.
Trimble (TRMB) Q3 CY2024 Highlights:
- Revenue: $875.8 million vs analyst estimates of $864.5 million (1.3% beat)
- Adjusted EPS: $0.70 vs analyst estimates of $0.62 (13.3% beat)
- EBITDA: $237.4 million vs analyst estimates of $213.8 million (11% beat)
- Revenue Guidance for Q4 CY2024 is $945 million at the midpoint, roughly in line with what analysts were expecting
- Management raised its full-year Adjusted EPS guidance to $2.83 at the midpoint, a 3.3% increase
- Gross Margin (GAAP): 65.7%, up from 64.6% in the same quarter last year
- Operating Margin: 13.3%, in line with the same quarter last year
- EBITDA Margin: 27.1%, in line with the same quarter last year
- Free Cash Flow Margin: 10.1%, down from 14% in the same quarter last year
- Organic Revenue rose 3% year on year (2% in the same quarter last year)
- Market Capitalization: $15.05 billion
"The Trimble team executed well in the quarter, exceeding expectations on both top and bottom lines, while delivering a record $2.19 billion of ARR and record gross margin of 68.5 percent," said Rob Painter, Trimble's President and Chief Executive Officer.
Company Overview
Playing a role in the construction of the Paris Grand, Trimble (NASDAQ: TRMB) offers geospatial devices and technology to the agriculture, construction, transportation, and logistics industries.
Internet of Things
Industrial Internet of Things (IoT) companies are buoyed by the secular trend of a more connected world. They often specialize in nascent areas such as hardware and services for factory automation, fleet tracking, or smart home technologies. Those who play their cards right can generate recurring subscription revenues by providing cloud-based software services, boosting their margins. On the other hand, if the technologies these companies have invested in don’t pan out, they may have to make costly pivots.
Sales Growth
A company’s long-term performance can give signals about its business quality. Even a bad business can shine for one or two quarters, but a top-tier one grows for years. Over the last five years, Trimble grew its sales at a sluggish 2.4% compounded annual growth rate. This shows it failed to expand in any major way, a rough starting point for our analysis.
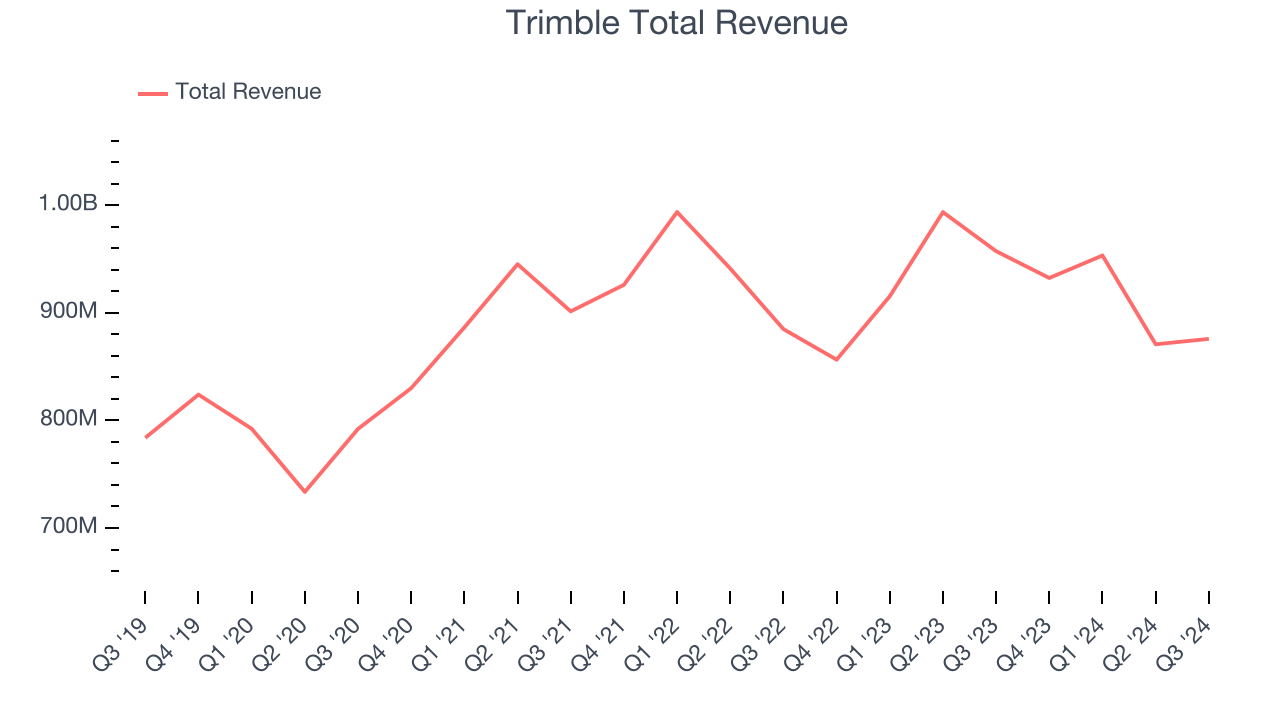
We at StockStory place the most emphasis on long-term growth, but within industrials, a half-decade historical view may miss cycles, industry trends, or a company capitalizing on catalysts such as a new contract win or a successful product line. Trimble’s history shows it grew in the past but relinquished its gains over the last two years, as its revenue fell by 1.5% annually. 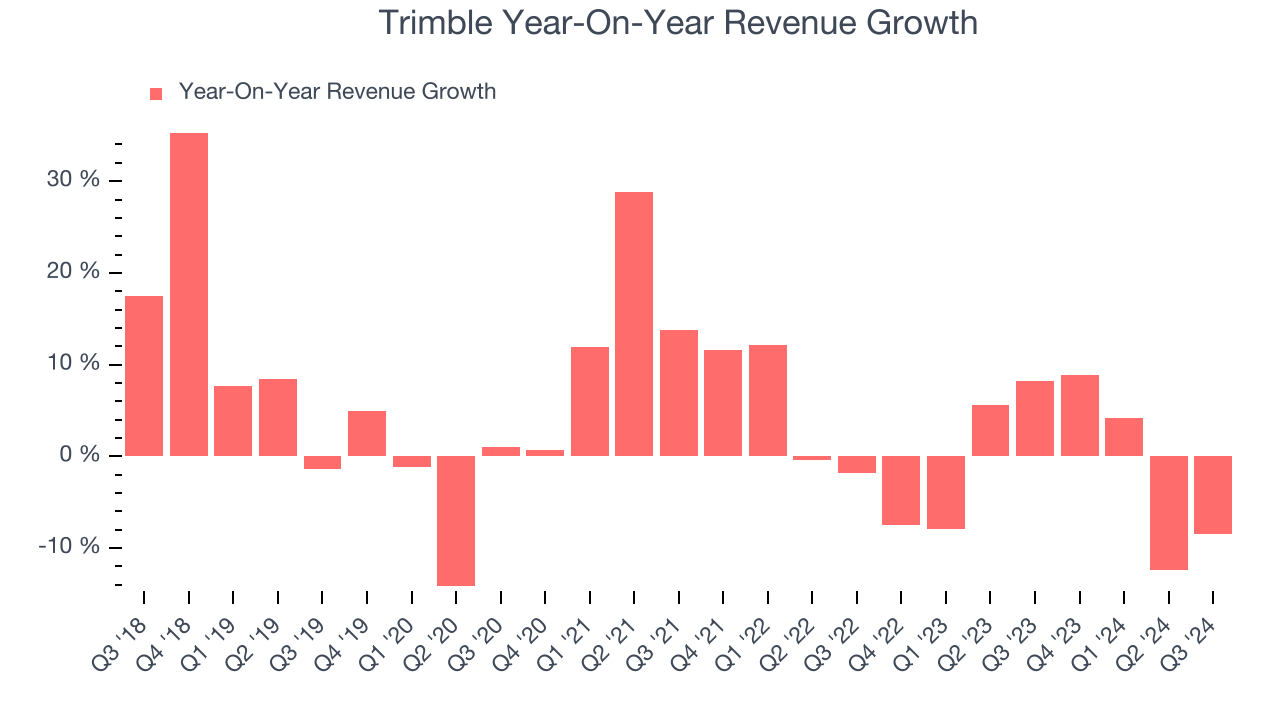
Trimble also reports organic revenue, which strips out one-time events like acquisitions and currency fluctuations because they don’t accurately reflect its fundamentals. Over the last two years, Trimble’s organic revenue averaged 7% year-on-year growth. Because this number is better than its normal revenue growth, we can see that some mixture of divestitures and foreign exchange rates dampened its headline performance. 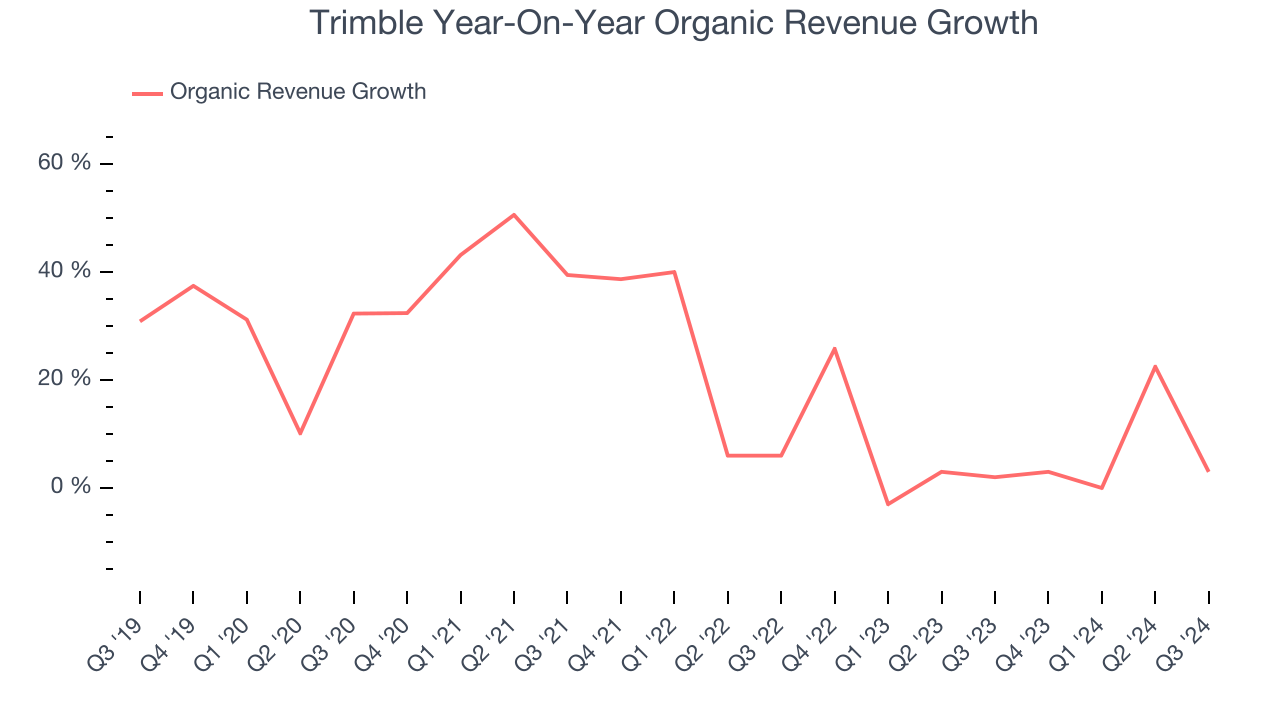
This quarter, Trimble’s revenue fell 8.5% year on year to $875.8 million but beat Wall Street’s estimates by 1.3%. Management is currently guiding for a 1.4% year-on-year increase next quarter.
Looking further ahead, sell-side analysts expect revenue to grow 2.1% over the next 12 months, an improvement versus the last two years. While this projection indicates the market thinks its newer products and services will fuel better performance, it is still below the sector average.
Here at StockStory, we certainly understand the potential of thematic investing. Diverse winners from Microsoft (MSFT) to Alphabet (GOOG), Coca-Cola (KO) to Monster Beverage (MNST) could all have been identified as promising growth stories with a megatrend driving the growth. So, in that spirit, we’ve identified a relatively under-the-radar profitable growth stock benefitting from the rise of AI, available to you FREE via this link.
Operating Margin
Trimble has been an optimally-run company over the last five years. It was one of the more profitable businesses in the industrials sector, boasting an average operating margin of 13%. This result isn’t surprising as its high gross margin gives it a favorable starting point.
Looking at the trend in its profitability, Trimble’s annual operating margin decreased by 1.7 percentage points over the last five years. Even though its margin is still high, shareholders will want to see Trimble become more profitable in the future.
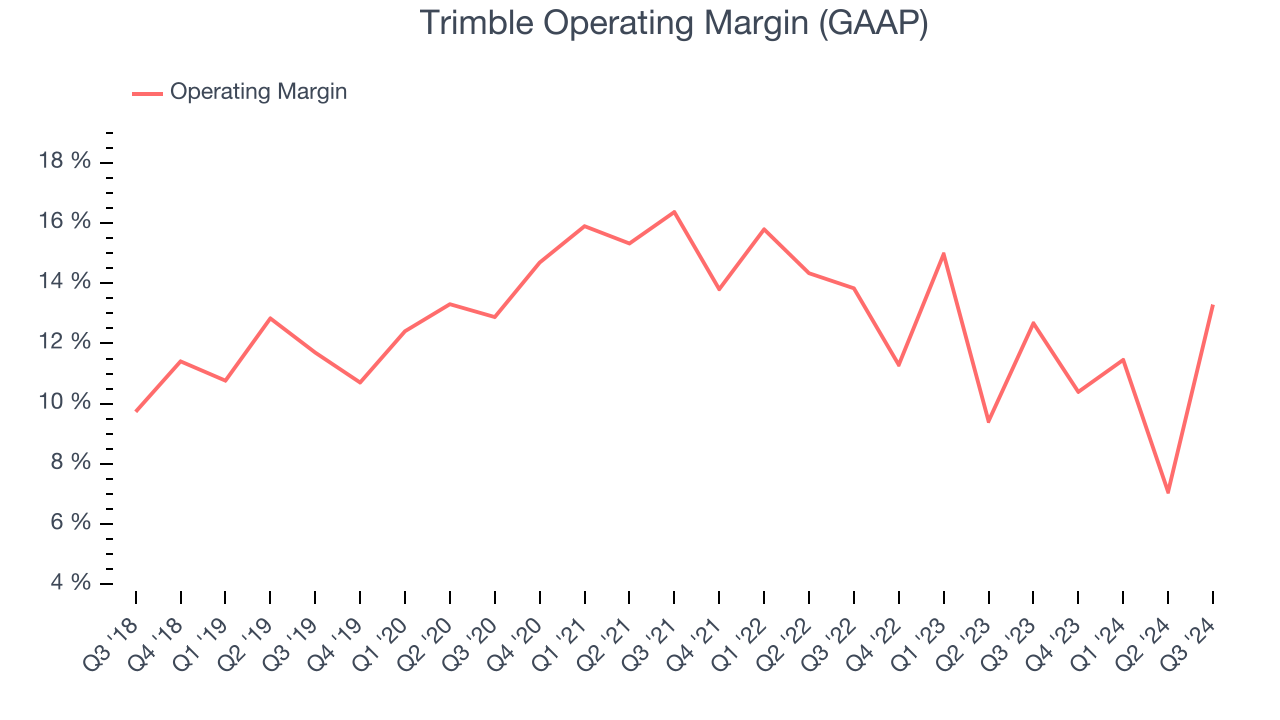
In Q3, Trimble generated an operating profit margin of 13.3%, in line with the same quarter last year. This indicates the company’s cost structure has recently been stable.
Earnings Per Share
We track the long-term change in earnings per share (EPS) for the same reason as long-term revenue growth. Compared to revenue, however, EPS highlights whether a company’s growth was profitable.
Trimble’s EPS grew at an unimpressive 6% compounded annual growth rate over the last five years. This performance was better than its 2.4% annualized revenue growth but doesn’t tell us much about its business quality because its operating margin didn’t expand.
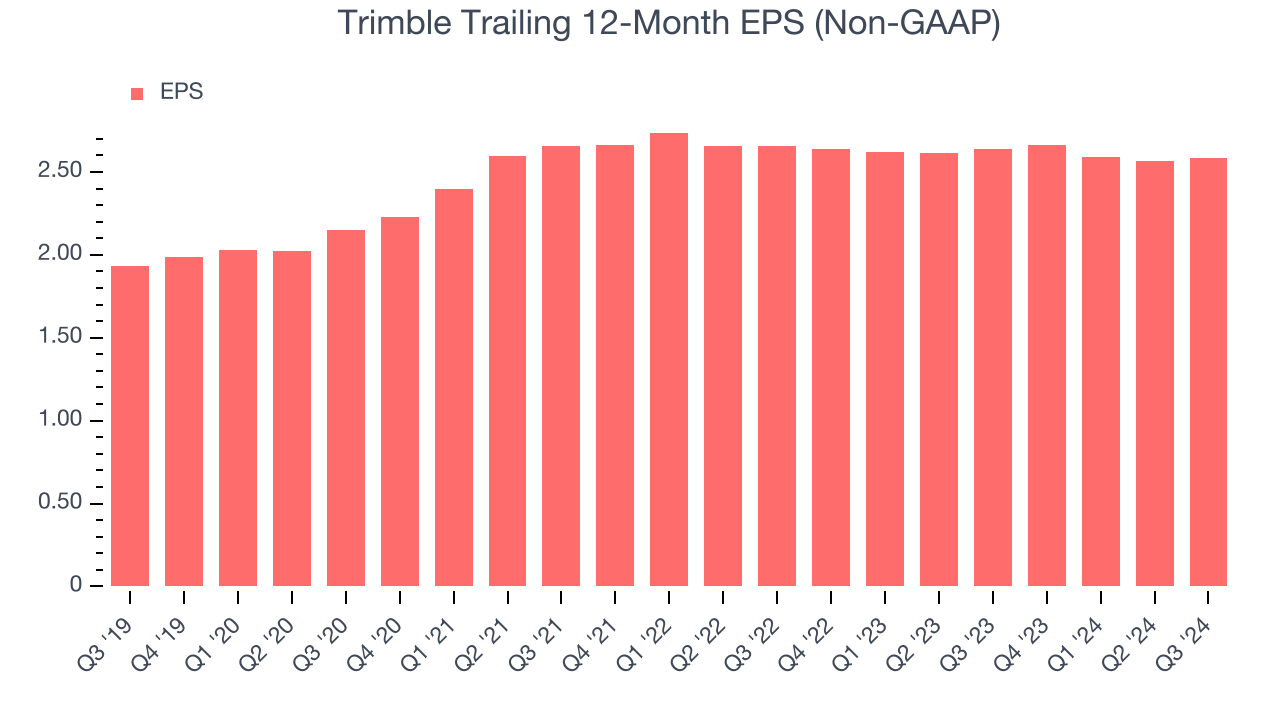
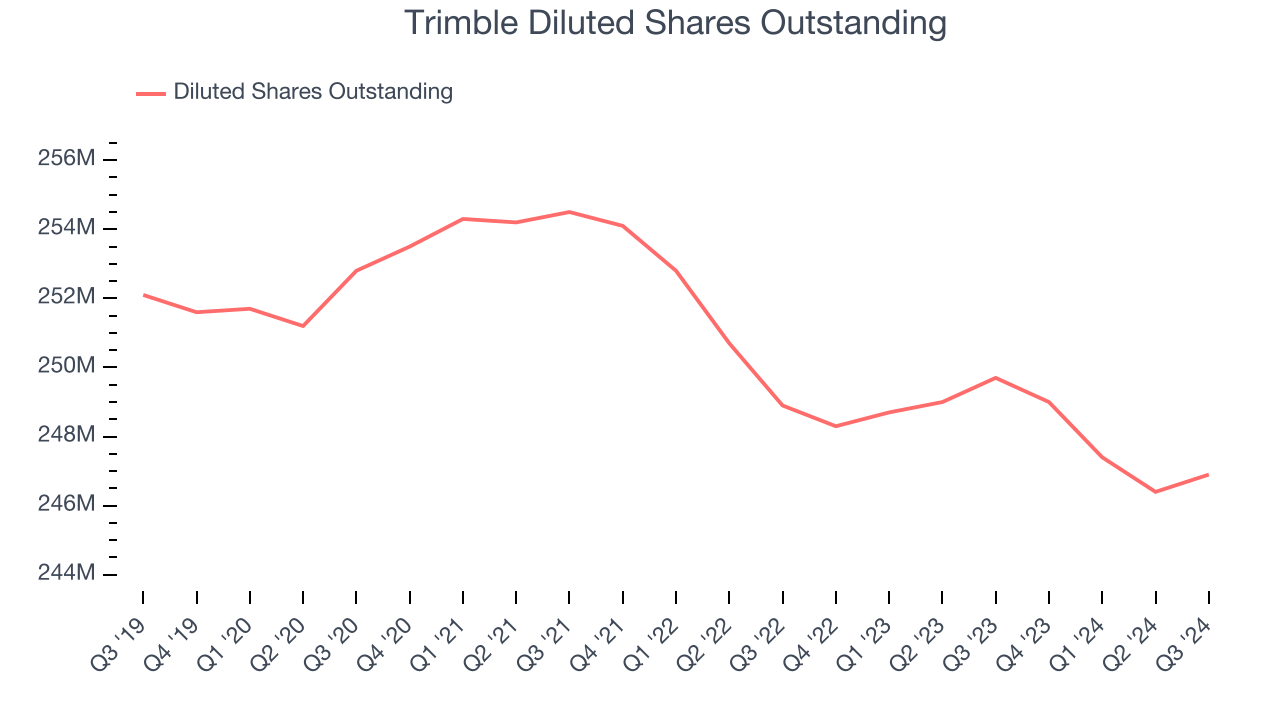
We can take a deeper look into Trimble’s earnings to better understand the drivers of its performance. A five-year view shows that Trimble has repurchased its stock, shrinking its share count by 2.1%. This tells us its EPS outperformed its revenue not because of increased operational efficiency but financial engineering, as buybacks boost per share earnings.
Like with revenue, we analyze EPS over a more recent period because it can give insight into an emerging theme or development for the business. For Trimble, its two-year annual EPS declines of 1.3% show it’s continued to underperform. These results were bad no matter how you slice the data.
In Q3, Trimble reported EPS at $0.70, up from $0.68 in the same quarter last year. This print easily cleared analysts’ estimates, and shareholders should be content with the results. Over the next 12 months, Wall Street expects Trimble’s full-year EPS of $2.58 to grow by 16.4%.
Key Takeaways from Trimble’s Q3 Results
We were impressed by how significantly Trimble blew past analysts’ EPS and EBITDA expectations this quarter. We were also glad it raised its full-year EPS guidance. On the other hand, its organic revenue missed, but this quarter still had some key positives. The stock traded up 6.4% to $65.55 immediately after reporting.
Is Trimble an attractive investment opportunity at the current price? If you’re making that decision, you should consider the bigger picture of valuation, business qualities, as well as the latest earnings. We cover that in our actionable full research report which you can read here, it’s free.