Railway infrastructure company L.B. Foster (NASDAQ: FSTR) missed Wall Street’s revenue expectations in Q3 CY2024, with sales falling 5.4% year on year to $137.5 million. The company’s full-year revenue guidance of $535 million at the midpoint came in slightly below analysts’ estimates. Its GAAP profit of $3.27 per share was 529% above analysts’ consensus estimates.
Is now the time to buy L.B. Foster? Find out by accessing our full research report, it’s free.
L.B. Foster (FSTR) Q3 CY2024 Highlights:
- Revenue: $137.5 million vs analyst estimates of $142.3 million (3.4% miss)
- EBITDA: $12.33 million vs analyst estimates of $11.11 million (10.9% beat)
- The company reconfirmed its revenue guidance for the full year of $535 million at the midpoint
- EBITDA guidance for the full year is $35.5 million at the midpoint, above analyst estimates of $33.58 million
- Gross Margin (GAAP): 23.8%, up from 20.2% in the same quarter last year
- Operating Margin: 5.3%, up from 2.6% in the same quarter last year
- EBITDA Margin: 9%, up from 4.9% in the same quarter last year
- Backlog: $209 million at quarter end
- Market Capitalization: $232.3 million
John Kasel, President and Chief Executive Officer, commented "As expected, we started the second half of the year with a strong quarter of profitability expansion and cash generation. These results are a clear indication that our strategy to transform the profitability profile of our business portfolio remains on track. While sales were down 5.4% year over year, gross margins improved to 23.8%, the highest level we've seen in over 10 years. Net income in the quarter was $35.9 million and reflected a $30.0 million benefit as we released our tax valuation allowance in line with the improving profitability trends and outlook, and adjusted EBITDA grew 16.4% to $12.3 million. We also had an exceptional cash generation quarter, with cash provided by operations totaling $24.7 million, up from $18.6 million last year. The operating cash was deployed to fund $3.1 million in capital programs supporting our growth initiatives and $2.6 million to repurchase 126,688 common shares in the quarter. This level of repurchases represents a 262% increase versus the average of the two previous quarters in 2024. Remaining funds were used to reduce our net debt by $17.7 million to $65.4 million at quarter end and down $3.3 million from $68.7 million last year. The lower borrowings and improved profitability translated into gross leverage per our credit facility of 1.9x at quarter end, which was improved compared to both 2.7x at the start of the quarter and 2.0x last year."
Company Overview
Founded with a $2,500 loan, L.B. Foster (NASDAQ: FSTR) is a provider of products and services for the transportation and energy infrastructure sectors, including rail products, construction materials, and coating solutions.
General Industrial Machinery
Automation that increases efficiency and connected equipment that collects analyzable data have been trending, creating new demand for general industrial machinery companies. Those who innovate and create digitized solutions can spur sales and speed up replacement cycles, but all general industrial machinery companies are still at the whim of economic cycles. Consumer spending and interest rates, for example, can greatly impact the industrial production that drives demand for these companies’ offerings.
Sales Growth
A company’s long-term performance can give signals about its business quality. Even a bad business can shine for one or two quarters, but a top-tier one grows for years. Over the last four years, L.B. Foster’s sales were flat. This shows demand was soft and is a tough starting point for our analysis.
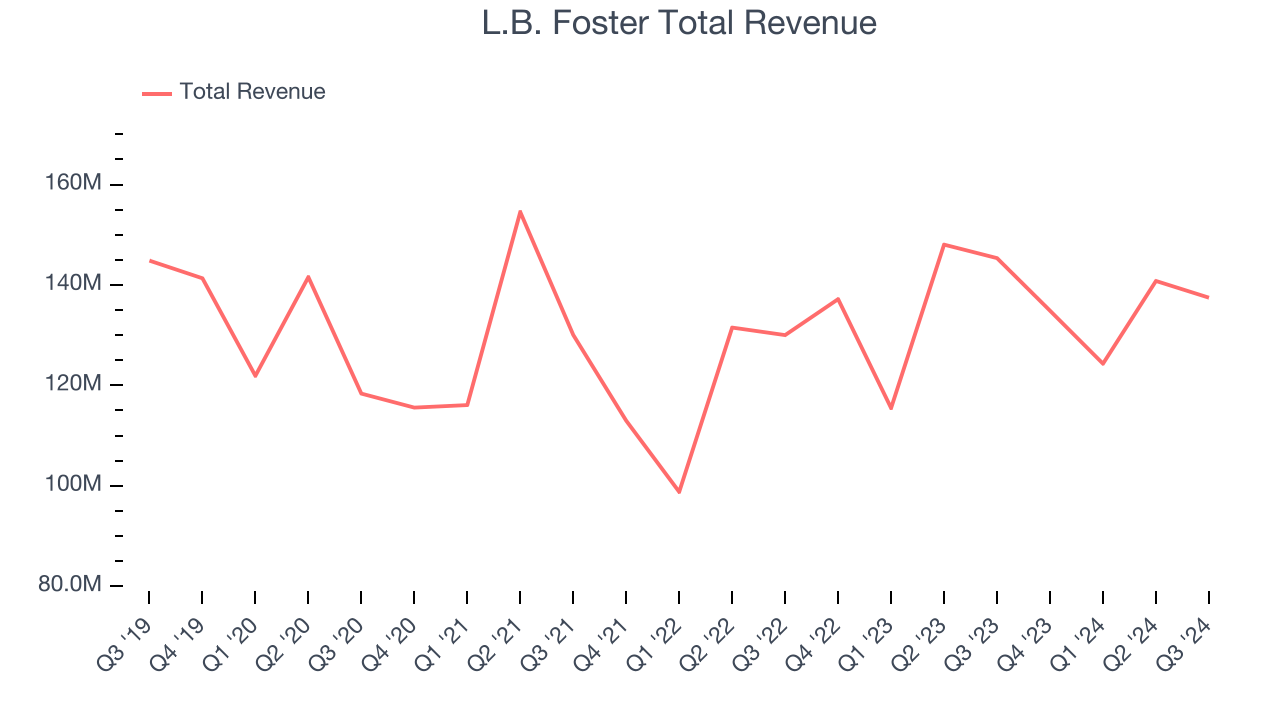
We at StockStory place the most emphasis on long-term growth, but within industrials, a stretched historical view may miss cycles, industry trends, or a company capitalizing on catalysts such as a new contract win or a successful product line. L.B. Foster’s annualized revenue growth of 6.6% over the last two years is above its four-year trend, but we were still disappointed by the results. 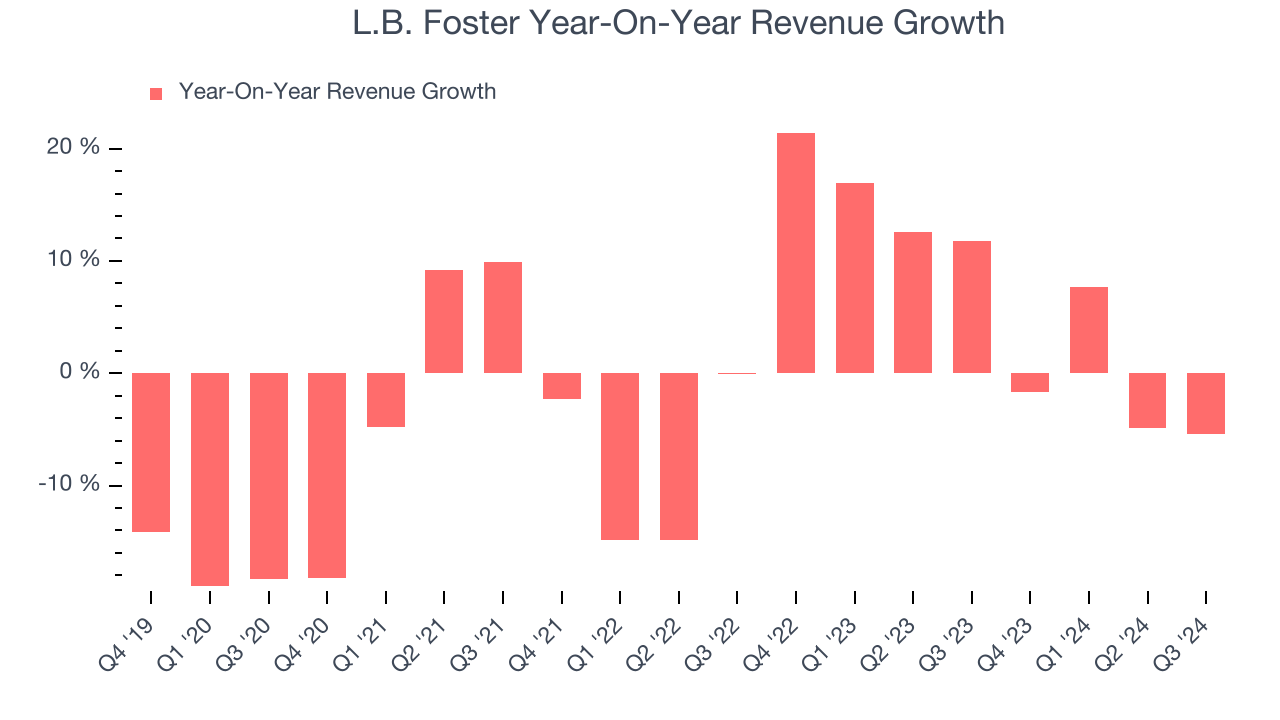
This quarter, L.B. Foster missed Wall Street’s estimates and reported a rather uninspiring 5.4% year-on-year revenue decline, generating $137.5 million of revenue.
We also like to judge companies based on their projected revenue growth, but not enough Wall Street analysts cover the company for it to have reliable consensus estimates.
When a company has more cash than it knows what to do with, buying back its own shares can make a lot of sense–as long as the price is right. Luckily, we’ve found one, a low-priced stock that is gushing free cash flow AND buying back shares. Click here to claim your Special Free Report on a fallen angel growth story that is already recovering from a setback.
Operating Margin
Operating margin is an important measure of profitability as it shows the portion of revenue left after accounting for all core expenses–everything from the cost of goods sold to advertising and wages. It’s also useful for comparing profitability across companies with different levels of debt and tax rates because it excludes interest and taxes.
L.B. Foster was profitable over the last five years but held back by its large cost base. Its average operating margin of 2.1% was weak for an industrials business. This result isn’t too surprising given its low gross margin as a starting point.
Analyzing the trend in its profitability, L.B. Foster’s annual operating margin might have seen some fluctuations but has generally stayed the same over the last five years, meaning it will take a fundamental shift in the business to change.
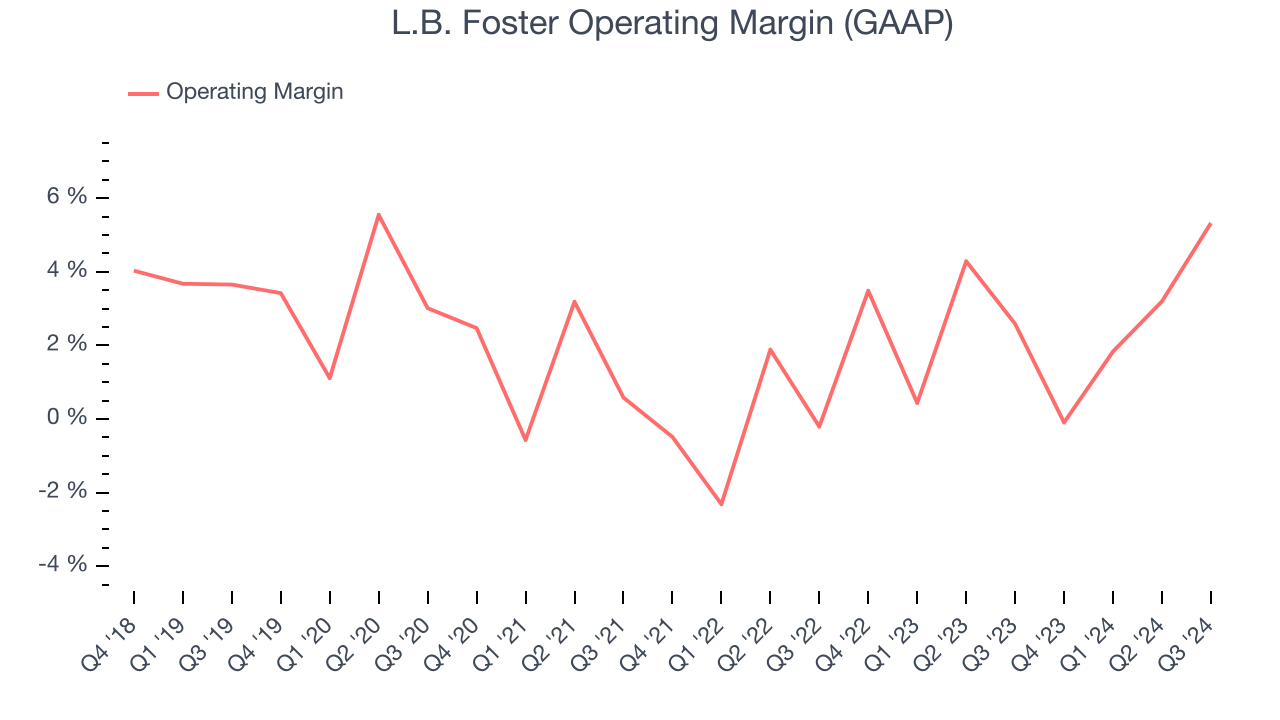
In Q3, L.B. Foster generated an operating profit margin of 5.3%, up 2.7 percentage points year on year. Since its gross margin expanded more than its operating margin, we can infer that leverage on its cost of sales was the primary driver behind the recently higher efficiency.
Key Takeaways from L.B. Foster’s Q3 Results
We were impressed by how significantly L.B. Foster blew past analysts’ EPS expectations this quarter. We were also excited its EBITDA outperformed Wall Street’s estimates. On the other hand, its revenue missed and its full-year revenue guidance slightly fell short of Wall Street’s estimates. Overall, this quarter was mixed but still had some key positives. The stock remained flat at $21.21 immediately following the results.
L.B. Foster had an encouraging quarter, but one earnings result doesn’t necessarily make the stock a buy. Let’s see if this is a good investment. When making that decision, it’s important to consider its valuation, business qualities, as well as what has happened in the latest quarter. We cover that in our actionable full research report which you can read here, it’s free.