Local broadcasting and digital media company Nexstar (NASDAQ: NXST) met Wall Street’s revenue expectations in Q3 CY2024, with sales up 20.7% year on year to $1.37 billion. Its GAAP profit of $5.27 per share was 1.5% below analysts’ consensus estimates.
Is now the time to buy Nexstar Media? Find out by accessing our full research report, it’s free.
Nexstar Media (NXST) Q3 CY2024 Highlights:
- Revenue: $1.37 billion vs analyst estimates of $1.36 billion (in line)
- EPS: $5.27 vs analyst expectations of $5.35 (1.5% miss)
- EBITDA: $510 million vs analyst estimates of $475.7 million (7.2% beat)
- Gross Margin (GAAP): 58.8%, up from 53.2% in the same quarter last year
- Operating Margin: 24.5%, up from 8.3% in the same quarter last year
- EBITDA Margin: 37.3%, up from 21.5% in the same quarter last year
- Free Cash Flow Margin: 26.2%, up from 7.5% in the same quarter last year
- Market Capitalization: $5.91 billion
IRVING, Texas--(BUSINESS WIRE)--Nexstar Media Group, Inc. (NASDAQ: NXST) (“Nexstar” or the “Company”) today reported financial results for the third quarter ended September 30, 2024 as summarized below.
Company Overview
Founded in 1996, Nexstar (NASDAQ: NXST) is an American media company operating numerous local television stations and digital media outlets across the country.
Broadcasting
Broadcasting companies have been facing secular headwinds in the form of consumers abandoning traditional television and radio in favor of streaming services. As a result, many broadcasting companies have evolved by forming distribution agreements with major streaming platforms so they can get in on part of the action, but will these subscription revenues be as high quality and high margin as their legacy revenues? Only time will tell which of these broadcasters will survive the sea changes of technological advancement and fragmenting consumer attention.
Sales Growth
A company’s long-term performance is an indicator of its overall business quality. While any business can experience short-term success, top-performing ones enjoy sustained growth for multiple years. Over the last five years, Nexstar Media grew its sales at a mediocre 13.8% compounded annual growth rate. This shows it couldn’t expand in any major way, a tough starting point for our analysis.
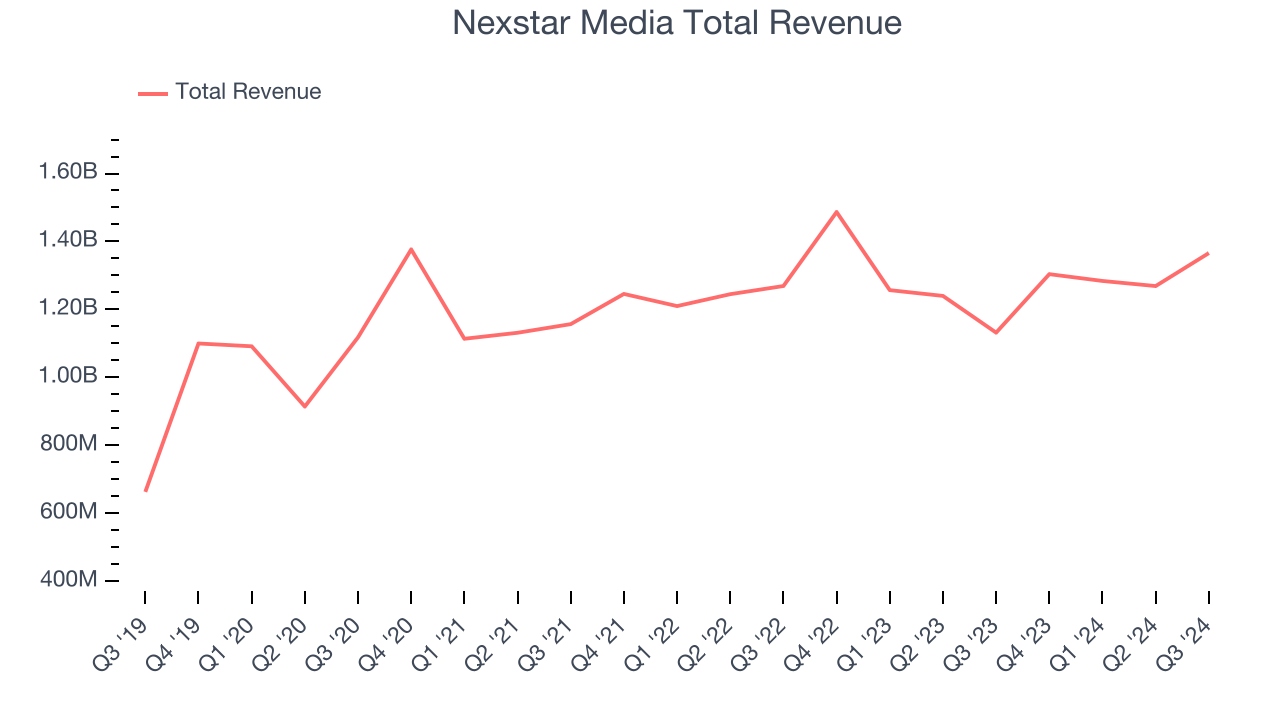
Long-term growth is the most important, but within consumer discretionary, product cycles are short and revenue can be hit-driven due to rapidly changing trends and consumer preferences. Nexstar Media’s recent history shows its demand slowed as its annualized revenue growth of 2.5% over the last two years is below its five-year trend. 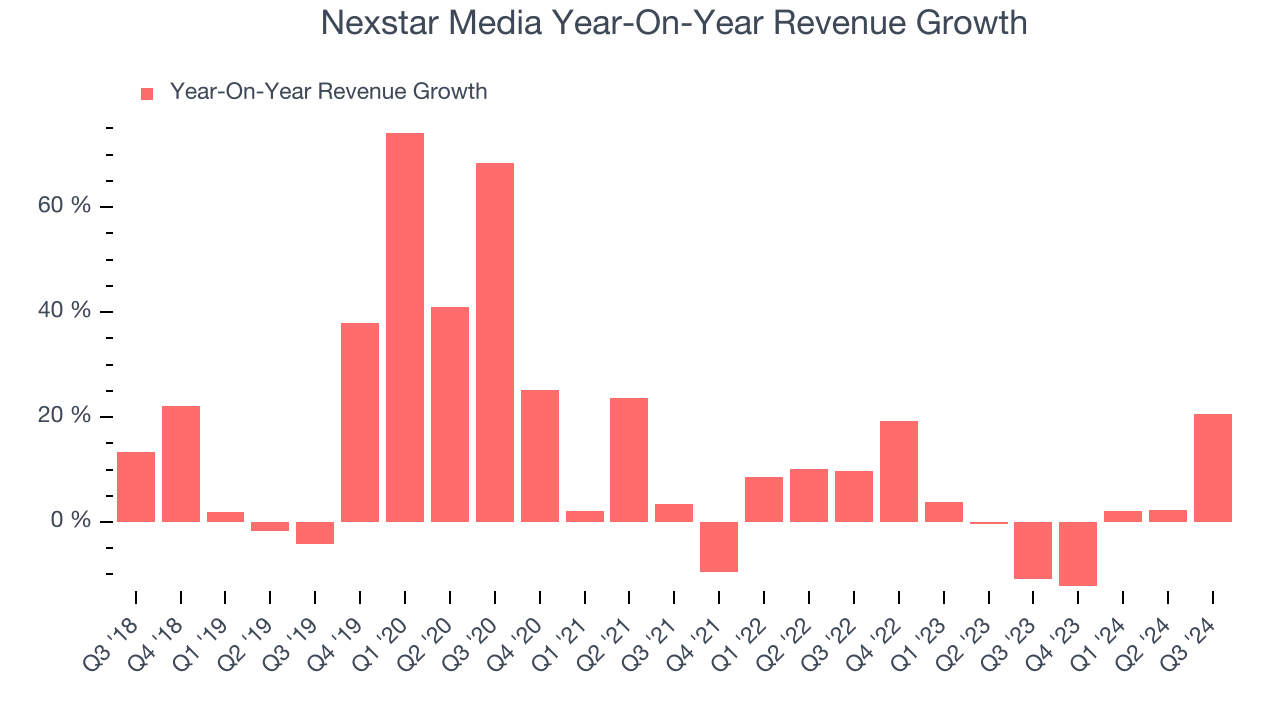
We can better understand the company’s revenue dynamics by analyzing its most important segments, Distribution and Core Advertising, which are 52.6% and 45.5% of revenue. Over the last two years, Nexstar Media’s Distribution revenue (licensing and affiliate fees) averaged 6.8% year-on-year growth while its Core Advertising revenue (TV and radio ads) averaged 9.4% growth.
This quarter, Nexstar Media’s year-on-year revenue growth of 20.7% was excellent, and its $1.37 billion of revenue was in line with Wall Street’s estimates.
Looking ahead, sell-side analysts expect revenue to grow 3.1% over the next 12 months, similar to its two-year rate. This projection doesn't excite us and shows the market believes its newer products and services will not accelerate its top-line performance yet.
Today’s young investors won’t have read the timeless lessons in Gorilla Game: Picking Winners In High Technology because it was written more than 20 years ago when Microsoft and Apple were first establishing their supremacy. But if we apply the same principles, then enterprise software stocks leveraging their own generative AI capabilities may well be the Gorillas of the future. So, in that spirit, we are excited to present our Special Free Report on a profitable, fast-growing enterprise software stock that is already riding the automation wave and looking to catch the generative AI next.
Cash Is King
Free cash flow isn't a prominently featured metric in company financials and earnings releases, but we think it's telling because it accounts for all operating and capital expenses, making it tough to manipulate. Cash is king.
Nexstar Media has shown robust cash profitability, giving it an edge over its competitors and the ability to reinvest or return capital to investors. The company’s free cash flow margin averaged 19.6% over the last two years, quite impressive for a consumer discretionary business.
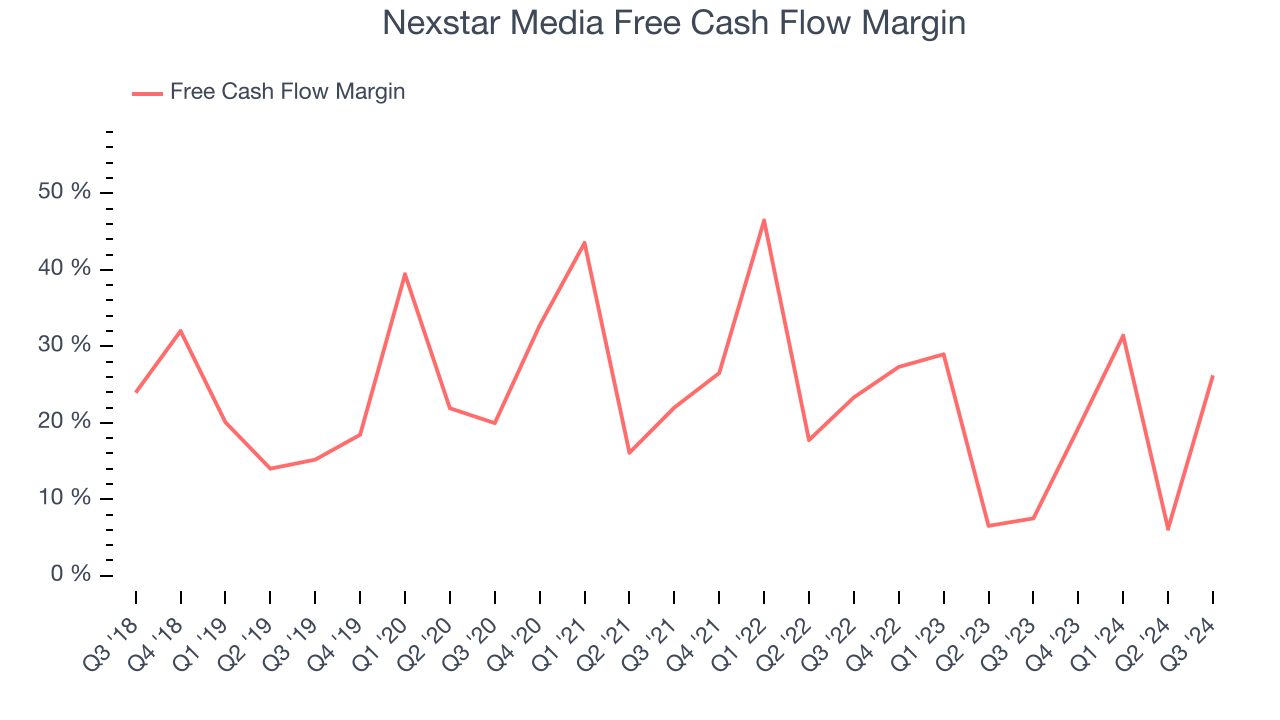
Nexstar Media’s free cash flow clocked in at $358 million in Q3, equivalent to a 26.2% margin. This result was good as its margin was 18.7 percentage points higher than in the same quarter last year, but we wouldn’t put too much weight on the short term because investment needs can be seasonal, causing temporary swings. Long-term trends are more important.
Over the next year, analysts’ consensus estimates show they’re expecting Nexstar Media’s free cash flow margin of 20.9% for the last 12 months to remain the same.
Key Takeaways from Nexstar Media’s Q3 Results
We enjoyed seeing Nexstar Media exceed analysts’ Core Advertising revenue expectations this quarter. We were also glad its EBITDA outperformed Wall Street’s estimates. Zooming out, we think this was a decent quarter. The stock traded up 3% to $188.64 immediately following the results.
Is Nexstar Media an attractive investment opportunity right now? What happened in the latest quarter matters, but not as much as longer-term business quality and valuation, when deciding whether to invest in this stock. We cover that in our actionable full research report which you can read here, it’s free.