
Laser company nLIGHT (NASDAQ: LASR) reported Q3 CY2024 results exceeding the market’s revenue expectations, with sales up 10.9% year on year to $56.13 million. On the other hand, next quarter’s revenue guidance of $51.5 million was less impressive, coming in 14.1% below analysts’ estimates. Its non-GAAP loss of $0.08 per share was also 3% above analysts’ consensus estimates.
Is now the time to buy nLIGHT? Find out by accessing our full research report, it’s free.
nLIGHT (LASR) Q3 CY2024 Highlights:
- Revenue: $56.13 million vs analyst estimates of $55.37 million (1.4% beat)
- Adjusted EPS: -$0.08 vs analyst estimates of -$0.08 (in line)
- EBITDA: -$994,000 vs analyst estimates of -$669,000 (miss)
- Revenue Guidance for Q4 CY2024 is $51.5 million at the midpoint, below analyst estimates of $59.98 million
- EBITDA guidance for Q4 CY2024 is -$3.5 million at the midpoint, below analyst estimates of $551,600
- Gross Margin (GAAP): 22.4%, up from 19.6% in the same quarter last year
- Operating Margin: -21%, up from -24.7% in the same quarter last year
- EBITDA Margin: -1.8%, up from -3.8% in the same quarter last year
- Free Cash Flow was -$7.23 million, down from $10.4 million in the same quarter last year
- Market Capitalization: $676.6 million
"Driven by record results in Aerospace & Defense, third quarter revenue of $56.1 million was above the midpoint of our guidance range and increased 11% compared to the third quarter of 2023,” commented Scott Keeney, nLIGHT’s President & Chief Executive Officer.
Company Overview
Founded by a former CEO and Harvard-educated entrepreneur Scott Keeneyn, nLIGHT (NASDAQ: LASR) offers semiconductor and fiber lasers to the industrial, aerospace & defense, and medical sectors.
Electronic Components
Like many equipment and component manufacturers, electronic components companies are buoyed by secular trends such as connectivity and industrial automation. More specific pockets of strong demand include data centers and telecommunications, which can benefit companies whose optical and transceiver offerings fit those markets. But like the broader industrials sector, these companies are also at the whim of economic cycles. Consumer spending, for example, can greatly impact these companies’ volumes.
Sales Growth
A company’s long-term performance is an indicator of its overall business quality. While any business can experience short-term success, top-performing ones enjoy sustained growth for multiple years. Regrettably, nLIGHT’s sales grew at a sluggish 2.5% compounded annual growth rate over the last five years. This shows it failed to expand in any major way, a rough starting point for our analysis.
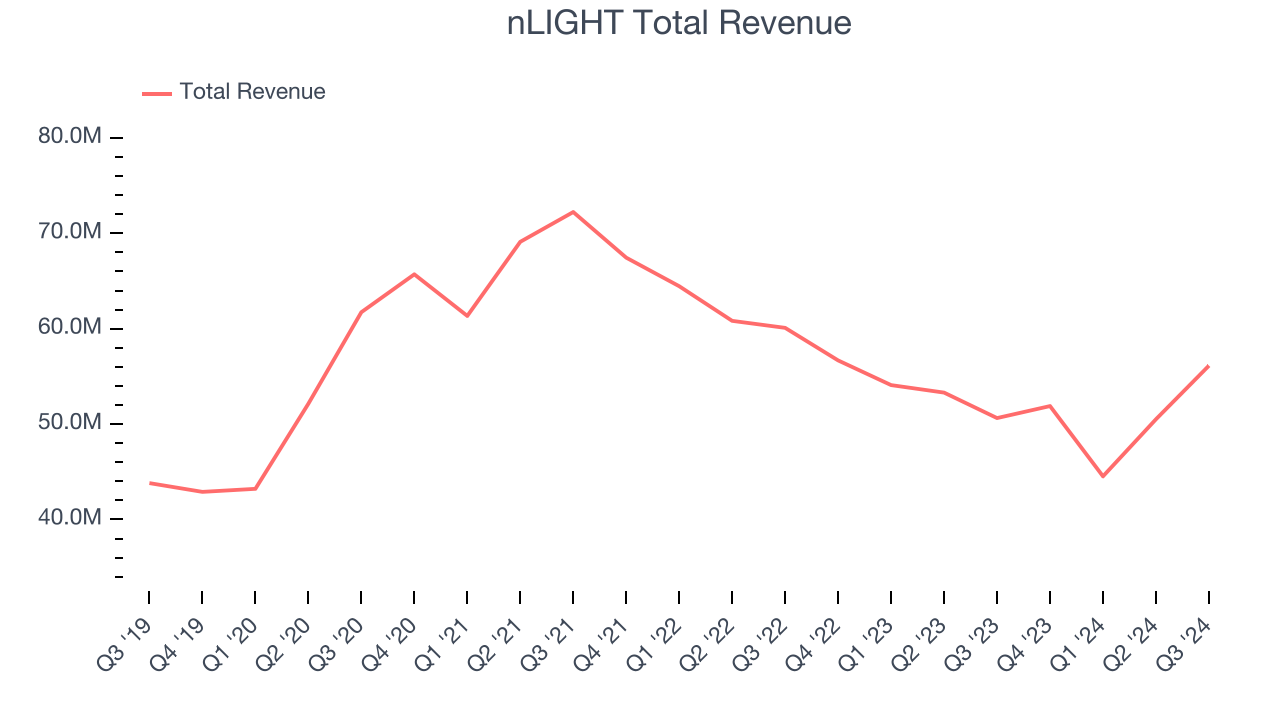
We at StockStory place the most emphasis on long-term growth, but within industrials, a half-decade historical view may miss cycles, industry trends, or a company capitalizing on catalysts such as a new contract win or a successful product line. nLIGHT’s history shows it grew in the past but relinquished its gains over the last two years, as its revenue fell by 10.4% annually. 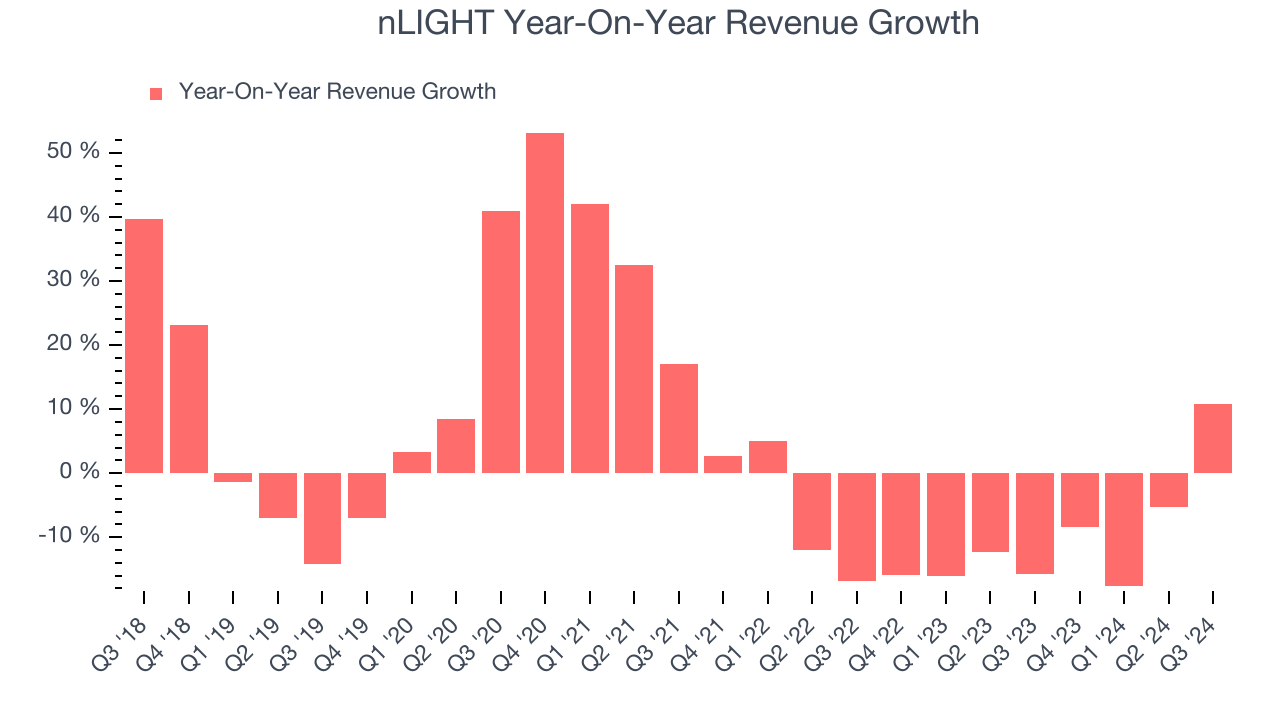
nLIGHT also breaks out the revenue for its most important segments, Laser Products and Advanced Developments, which are 73.3% and 26.7% of revenue. Over the last two years, nLIGHT’s Laser Products revenue (lasers, amplifiers, and directed energy products) averaged 14.9% year-on-year declines. On the other hand, its Advanced Developments revenue (R&D contracts) averaged 6.9% growth.
This quarter, nLIGHT reported year-on-year revenue growth of 10.9%, and its $56.13 million of revenue exceeded Wall Street’s estimates by 1.4%. Management is currently guiding for flat sales next quarter.
Looking further ahead, sell-side analysts expect revenue to grow 17.5% over the next 12 months, an improvement versus the last two years. This projection is healthy and illustrates the market thinks its newer products and services will catalyze higher growth rates.
Here at StockStory, we certainly understand the potential of thematic investing. Diverse winners from Microsoft (MSFT) to Alphabet (GOOG), Coca-Cola (KO) to Monster Beverage (MNST) could all have been identified as promising growth stories with a megatrend driving the growth. So, in that spirit, we’ve identified a relatively under-the-radar profitable growth stock benefitting from the rise of AI, available to you FREE via this link.
Operating Margin
nLIGHT’s high expenses have contributed to an average operating margin of negative 17.7% over the last five years. Unprofitable industrials companies require extra attention because they could get caught swimming naked when the tide goes out. It’s hard to trust that the business can endure a full cycle.
Analyzing the trend in its profitability, nLIGHT’s annual operating margin decreased by 13.5 percentage points over the last five years. The company’s performance was poor no matter how you look at it. It shows operating expenses were rising and it couldn’t pass those costs onto its customers.
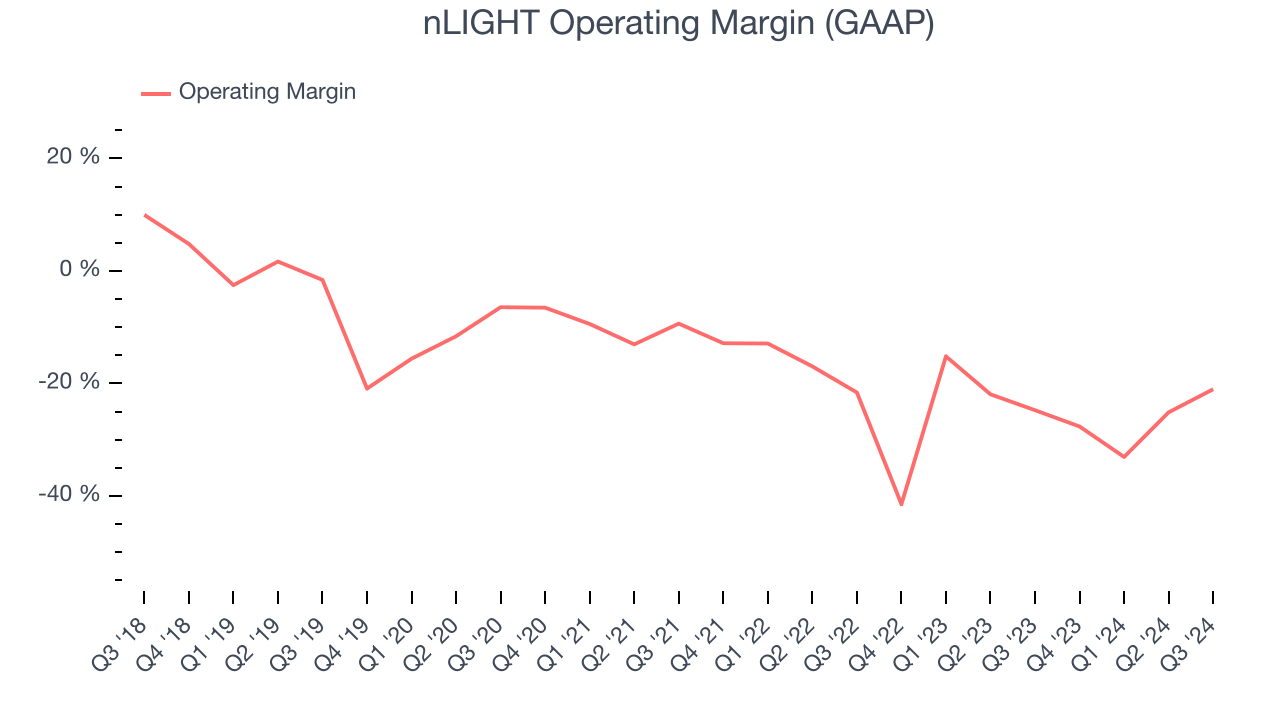
nLIGHT’s operating margin was negative 21% this quarter. The company's lacking profits are certainly concerning.
Earnings Per Share
Analyzing revenue trends tells us about a company’s historical growth, but the long-term change in its earnings per share (EPS) points to the profitability of that growth – for example, a company could inflate its sales through excessive spending on advertising and promotions.
Sadly for nLIGHT, its EPS declined by 35.9% annually over the last five years while its revenue grew by 2.5%. This tells us the company became less profitable on a per-share basis as it expanded.
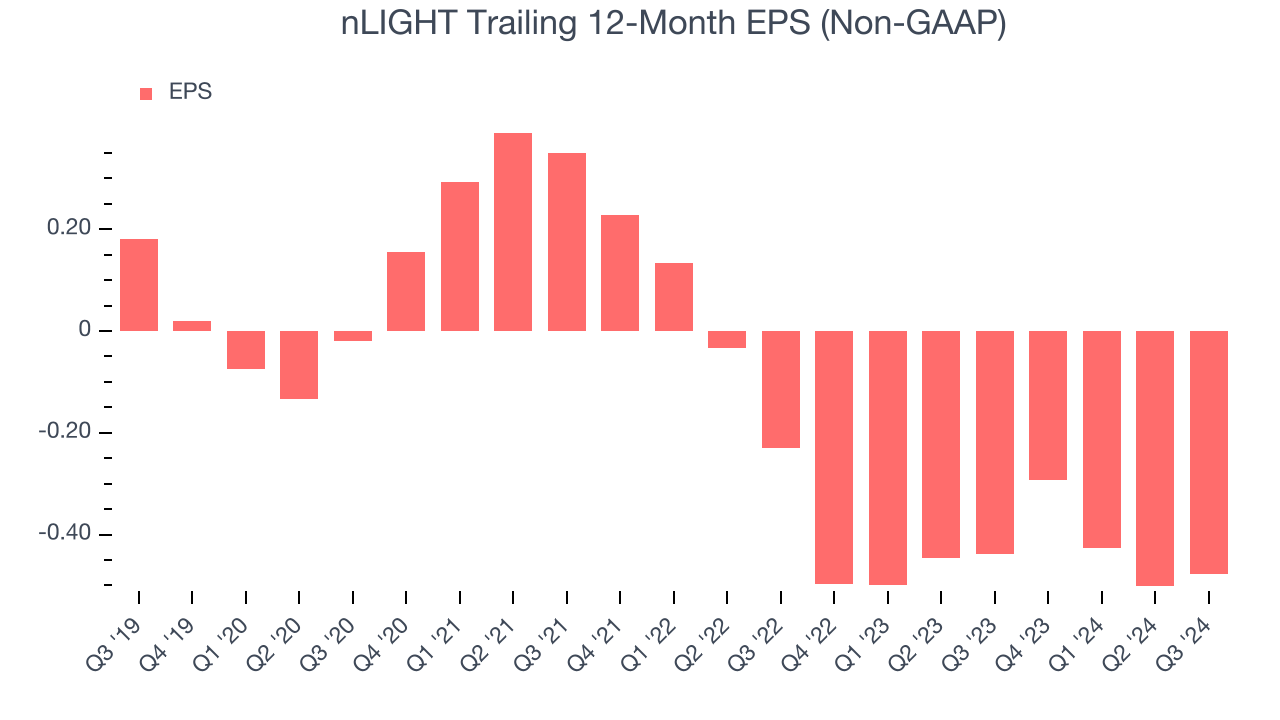
Diving into the nuances of nLIGHT’s earnings can give us a better understanding of its performance. As we mentioned earlier, nLIGHT’s operating margin improved this quarter but declined by 13.5 percentage points over the last five years. Its share count also grew by 29.2%, meaning the company not only became less efficient with its operating expenses but also diluted its shareholders. 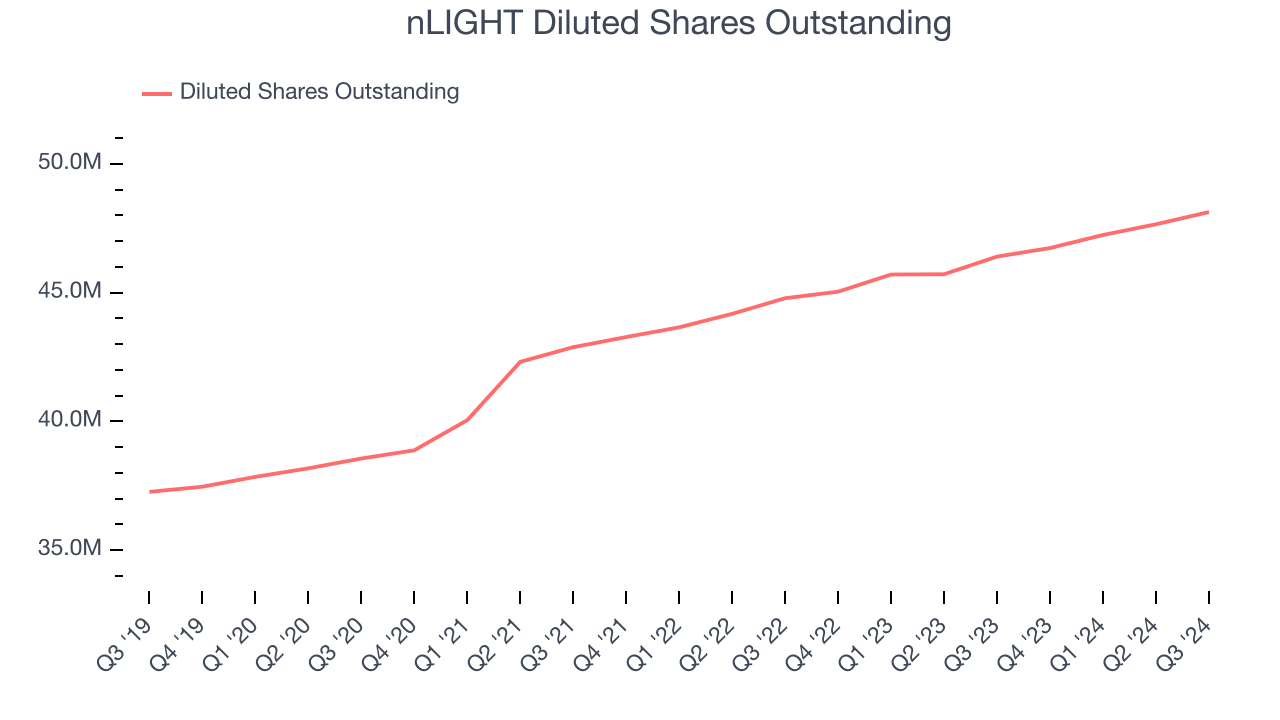
Like with revenue, we analyze EPS over a more recent period because it can give insight into an emerging theme or development for the business.
For nLIGHT, its two-year annual EPS declines of 44.1% show it’s continued to underperform. These results were bad no matter how you slice the data.In Q3, nLIGHT reported EPS at negative $0.08, up from negative $0.10 in the same quarter last year. This print beat analysts’ estimates by 3%. Over the next 12 months, Wall Street is optimistic. Analysts forecast nLIGHT’s full-year EPS of negative $0.48 will reach break even.
Key Takeaways from nLIGHT’s Q3 Results
It was good to see nLIGHT beat analysts’ revenue expectations this quarter. We were also glad its EPS outperformed Wall Street’s estimates. On the other hand, its revenue guidance for next quarter missed and its EBITDA fell short of Wall Street’s estimates. Overall, this was a softer quarter. The stock traded down 8% to $13.52 immediately after reporting.
The latest quarter from nLIGHT’s wasn’t that good. One earnings report doesn’t define a company’s quality, though, so let’s explore whether the stock is a buy at the current price. We think that the latest quarter is only one piece of the longer-term business quality puzzle. Quality, when combined with valuation, can help determine if the stock is a buy. We cover that in our actionable full research report which you can read here, it’s free.


