
Global wind blade manufacturer TPI Composites (NASDAQ: TPIC) reported Q3 CY2024 results topping the market’s revenue expectations, with sales up 2.1% year on year to $380.8 million. The company expects the full year’s revenue to be around $1.35 billion, close to analysts’ estimates. Its GAAP loss of $0.81 per share was 464% below analysts’ consensus estimates.
Is now the time to buy TPI Composites? Find out by accessing our full research report, it’s free.
TPI Composites (TPIC) Q3 CY2024 Highlights:
- Revenue: $380.8 million vs analyst estimates of $359.6 million (5.9% beat)
- EPS: -$0.81 vs analyst estimates of -$0.14 (-$0.67 miss)
- EBITDA: $8.01 million vs analyst estimates of $20.51 million (60.9% miss)
- The company reconfirmed its revenue guidance for the full year of $1.35 billion at the midpoint
- Gross Margin (GAAP): 0.7%, up from -1.7% in the same quarter last year
- Operating Margin: -3%, up from -12.6% in the same quarter last year
- EBITDA Margin: 2.1%, up from -7.3% in the same quarter last year
- Free Cash Flow was -$5.61 million compared to -$20.81 million in the same quarter last year
- Market Capitalization: $140.8 million
“The third quarter marked a significant improvement for the company, showcasing improved profitability with positive adjusted EBITDA. This improvement was largely driven by 89% utilization in our plants as we made progress on transitioning/starting up ten lines with next-generation workhorse blades. Our results also benefited from eliminating losses that had been burdening our financial performance by divesting the Automotive business and shutting down the Nordex Matamoros plant at the end of the second quarter of this year. Sales reached $380.8 million, reflecting 23% sequential, quarterly growth, and positioning us well to achieve the mid-point of our full-year sales guidance,” said Bill Siwek, President and CEO of TPI Composites.”
Company Overview
Founded in 1968, TPI Composites (NASDAQ: TPIC) manufactures composite wind turbine blades and provides related precision molding and assembly systems.
Renewable Energy
Renewable energy companies are buoyed by the secular trend of green energy that is upending traditional power generation. Those who innovate and evolve with this dynamic market can win share while those who continue to rely on legacy technologies can see diminishing demand, which includes headwinds from increasing regulation against “dirty” energy. Additionally, these companies are at the whim of economic cycles, as interest rates can impact the willingness to invest in renewable energy projects.
Sales Growth
A company’s long-term performance can indicate its business quality. Any business can put up a good quarter or two, but many enduring ones grow for years. TPI Composites’s demand was weak over the last five years as its sales were flat, a poor baseline for our analysis.
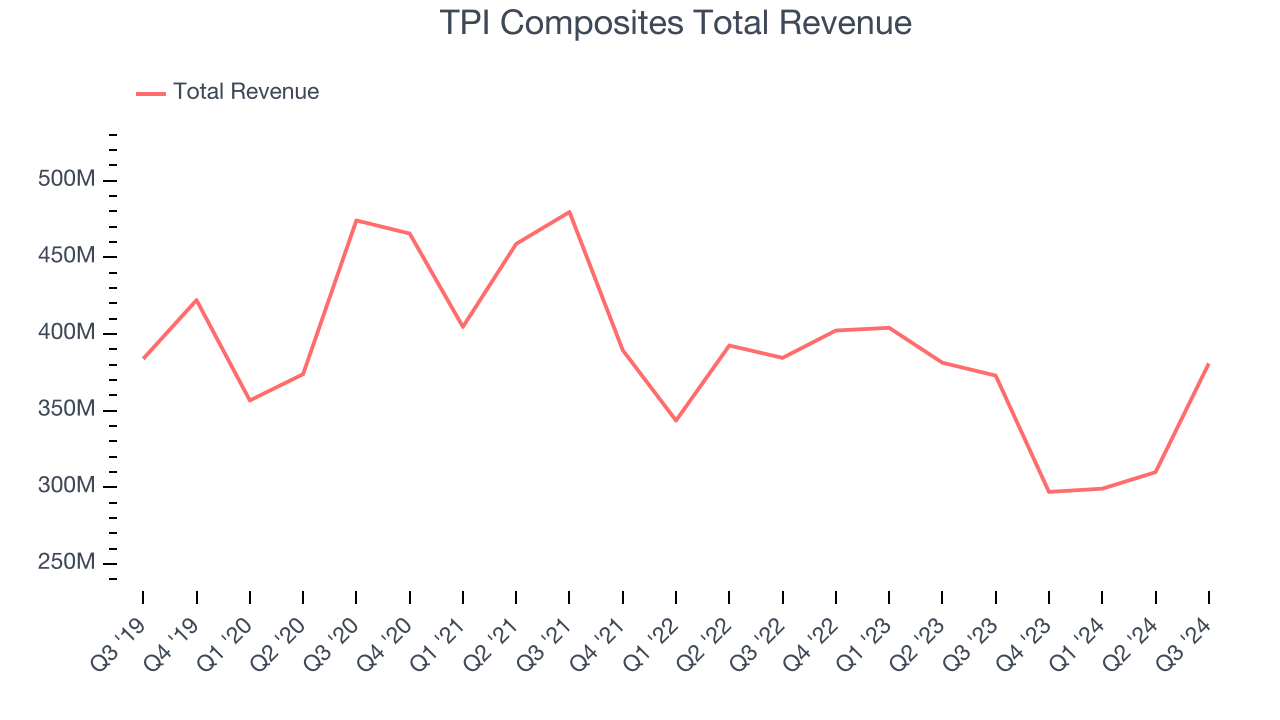
We at StockStory place the most emphasis on long-term growth, but within industrials, a half-decade historical view may miss cycles, industry trends, or a company capitalizing on catalysts such as a new contract win or a successful product line. TPI Composites’s recent history shows its demand has stayed suppressed as its revenue has declined by 7.7% annually over the last two years. 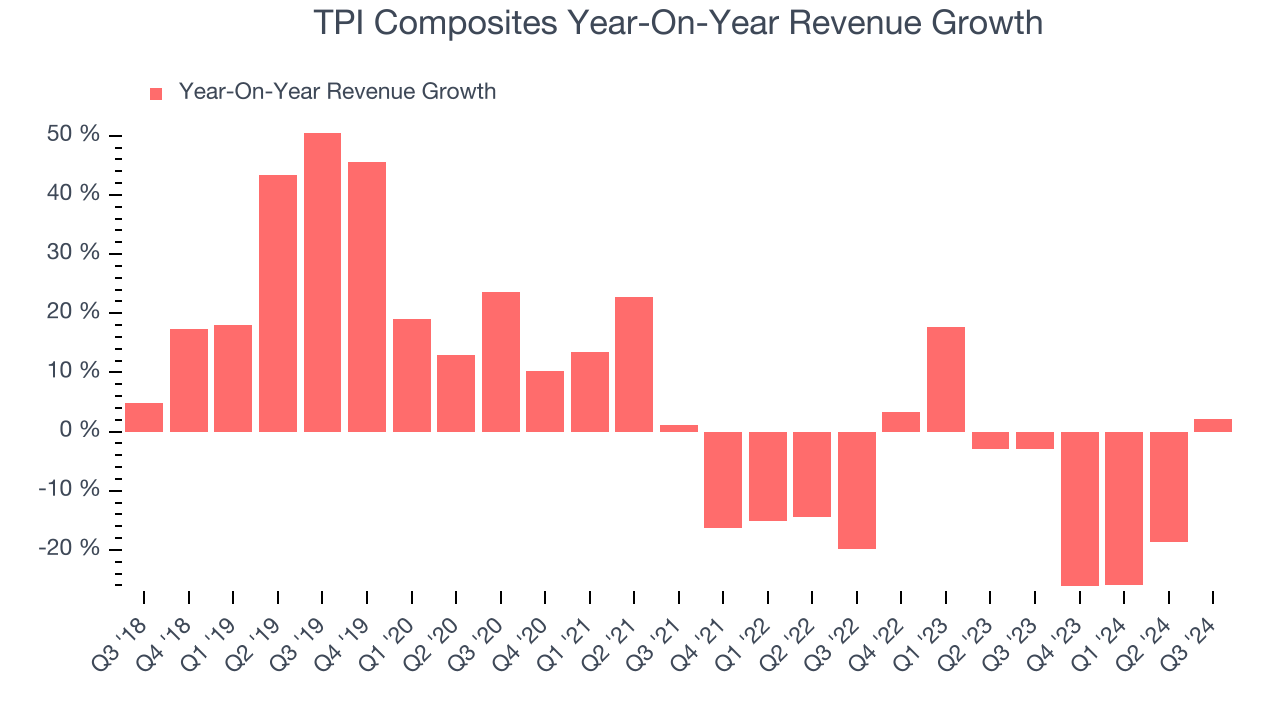
This quarter, TPI Composites reported modest year-on-year revenue growth of 2.1% but beat Wall Street’s estimates by 5.9%.
Looking ahead, sell-side analysts expect revenue to grow 23.4% over the next 12 months, an improvement versus the last two years. This projection is commendable and shows the market believes its newer products and services will spur faster growth.
Today’s young investors won’t have read the timeless lessons in Gorilla Game: Picking Winners In High Technology because it was written more than 20 years ago when Microsoft and Apple were first establishing their supremacy. But if we apply the same principles, then enterprise software stocks leveraging their own generative AI capabilities may well be the Gorillas of the future. So, in that spirit, we are excited to present our Special Free Report on a profitable, fast-growing enterprise software stock that is already riding the automation wave and looking to catch the generative AI next.
Operating Margin
TPI Composites’s high expenses have contributed to an average operating margin of negative 4.3% over the last five years. Unprofitable industrials companies require extra attention because they could get caught swimming naked when the tide goes out. It’s hard to trust that the business can endure a full cycle.
Analyzing the trend in its profitability, TPI Composites’s annual operating margin decreased by 11.1 percentage points over the last five years. The company’s performance was poor no matter how you look at it. It shows operating expenses were rising and it couldn’t pass those costs onto its customers.
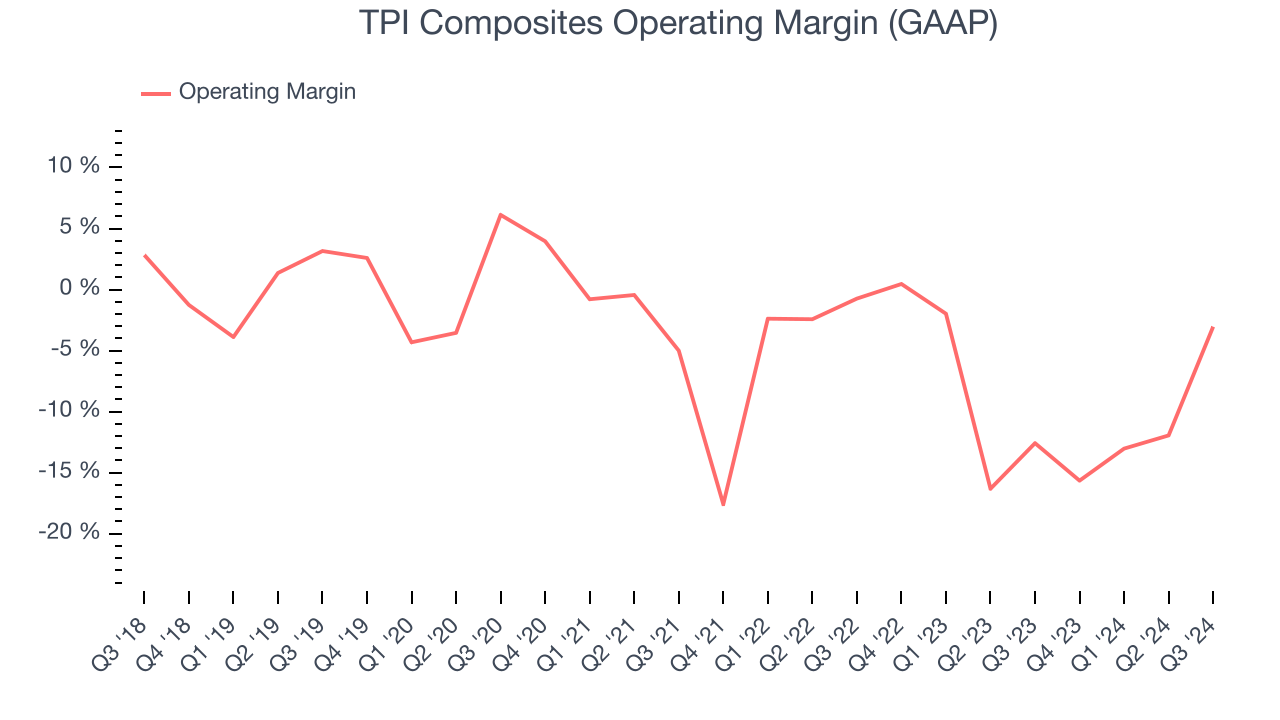
In Q3, TPI Composites generated a negative 3% operating margin. The company's lacking profits are certainly concerning.
Earnings Per Share
Analyzing revenue trends tells us about a company’s historical growth, but the long-term change in its earnings per share (EPS) points to the profitability of that growth – for example, a company could inflate its sales through excessive spending on advertising and promotions.
TPI Composites’s earnings losses deepened over the last five years as its EPS dropped 35.4% annually. We tend to steer our readers away from companies with falling EPS, where diminishing earnings could imply changing secular trends and preferences. If the tide turns unexpectedly, TPI Composites’s low margin of safety could leave its stock price susceptible to large downswings.
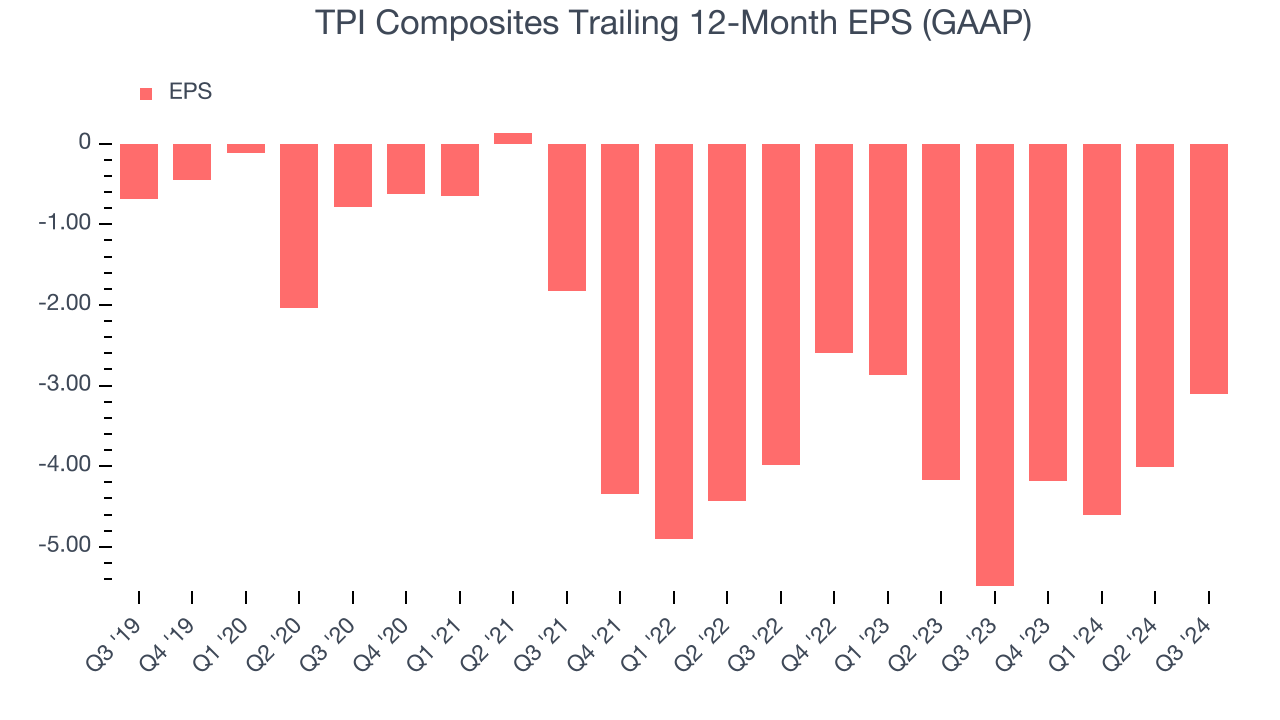
Like with revenue, we analyze EPS over a shorter period to see if we are missing a change in the business.
For TPI Composites, its two-year annual EPS growth of 11.7% was higher than its five-year trend. This acceleration made it one of the faster-growing industrials companies in recent history.In Q3, TPI Composites reported EPS at negative $0.81, up from negative $1.71 in the same quarter last year. Despite growing year on year, this print missed analysts’ estimates. Over the next 12 months, Wall Street is optimistic. Analysts forecast TPI Composites’s full-year EPS of negative $3.11 will reach break even.
Key Takeaways from TPI Composites’s Q3 Results
We were impressed by how significantly TPI Composites blew past analysts’ revenue expectations this quarter. On the other hand, its EBITDA and EPS fell short of Wall Street’s estimates. Overall, this was a mixed quarter. The stock traded up 3.9% to $2.90 immediately following the results.
Should you buy the stock or not? We think that the latest quarter is only one piece of the longer-term business quality puzzle. Quality, when combined with valuation, can help determine if the stock is a buy. We cover that in our actionable full research report which you can read here, it’s free.


