
Amplitude’s 29.5% return over the past six months has outpaced the S&P 500 by 17.1%, and its stock price has climbed to $10.85 per share. This was partly thanks to its solid quarterly results, and the performance may have investors wondering how to approach the situation.
Is now the time to buy Amplitude, or should you be careful about including it in your portfolio? Dive into our full research report to see our analyst team’s opinion, it’s free.Despite the momentum, we're sitting this one out for now. Here are three reasons why we avoid AMPL and a stock we'd rather own.
Why Is Amplitude Not Exciting?
Born out of a failed voice recognition startup by founder Spenser Skates, Amplitude (NASDAQ: AMPL) is data analytics software helping companies improve and optimize their digital products.
1. Weak Billings Point to Soft Demand
Billings is a non-GAAP metric that is often called “cash revenue” because it shows how much money the company has collected from customers in a certain period. This is different from revenue, which must be recognized in pieces over the length of a contract.
Amplitude’s billings came in at $65.69 million in Q3, and over the last four quarters, its year-on-year growth averaged 5.5%. This performance was underwhelming and suggests that increasing competition is causing challenges in acquiring/retaining customers. 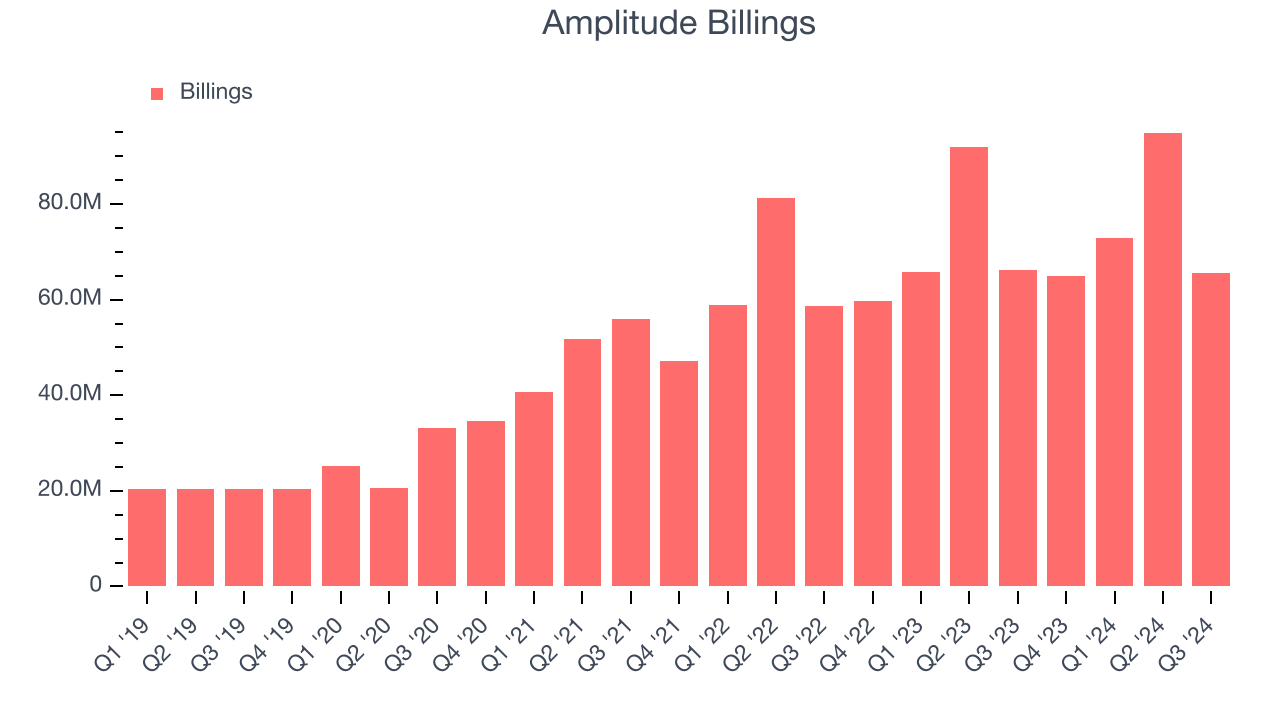
2. Customer Churn Hurts Long-Term Outlook
One of the best parts about the software-as-a-service business model (and a reason why they trade at high valuation multiples) is that customers typically spend more on a company’s products and services over time.
Amplitude’s net revenue retention rate, a key performance metric measuring how much money existing customers from a year ago are spending today, was 97.3% in Q3. This means Amplitude’s revenue would’ve decreased by 2.7% over the last 12 months if it didn’t win any new customers.
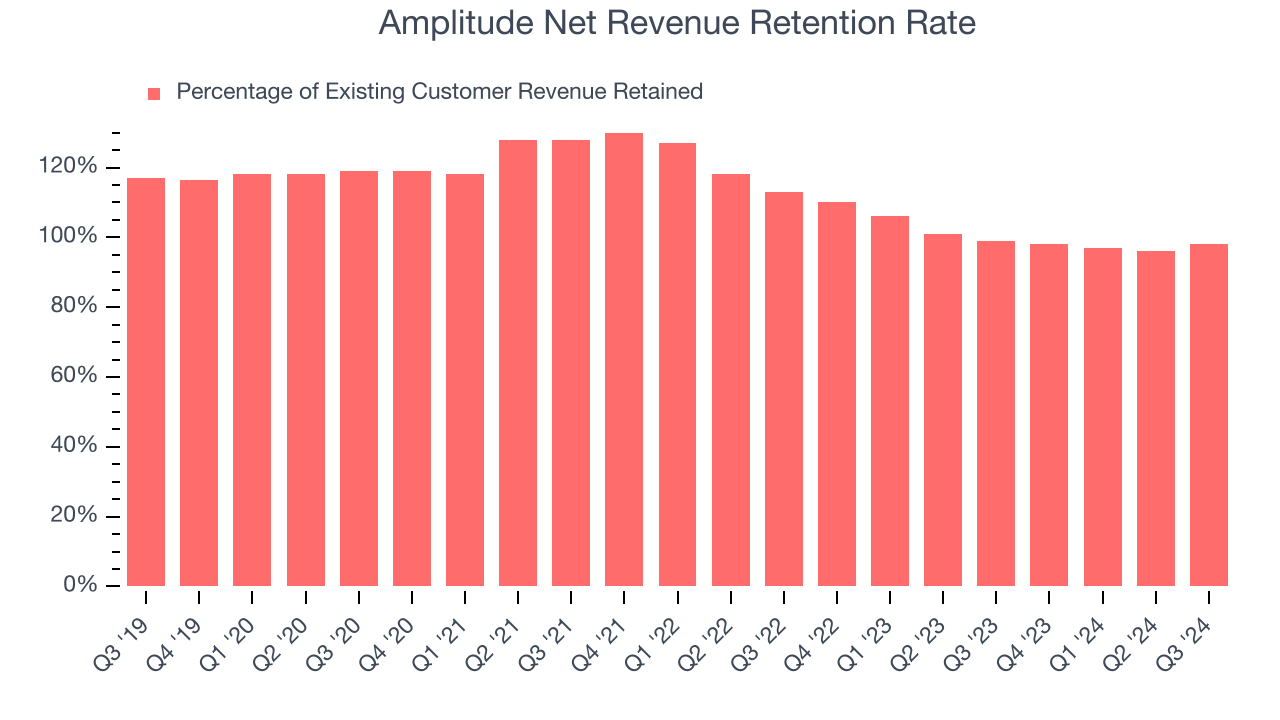
Amplitude has a weak net retention rate, signaling that some customers aren’t satisfied with its products, leading to lost contracts and revenue streams.
3. Operating Losses Sound the Alarms
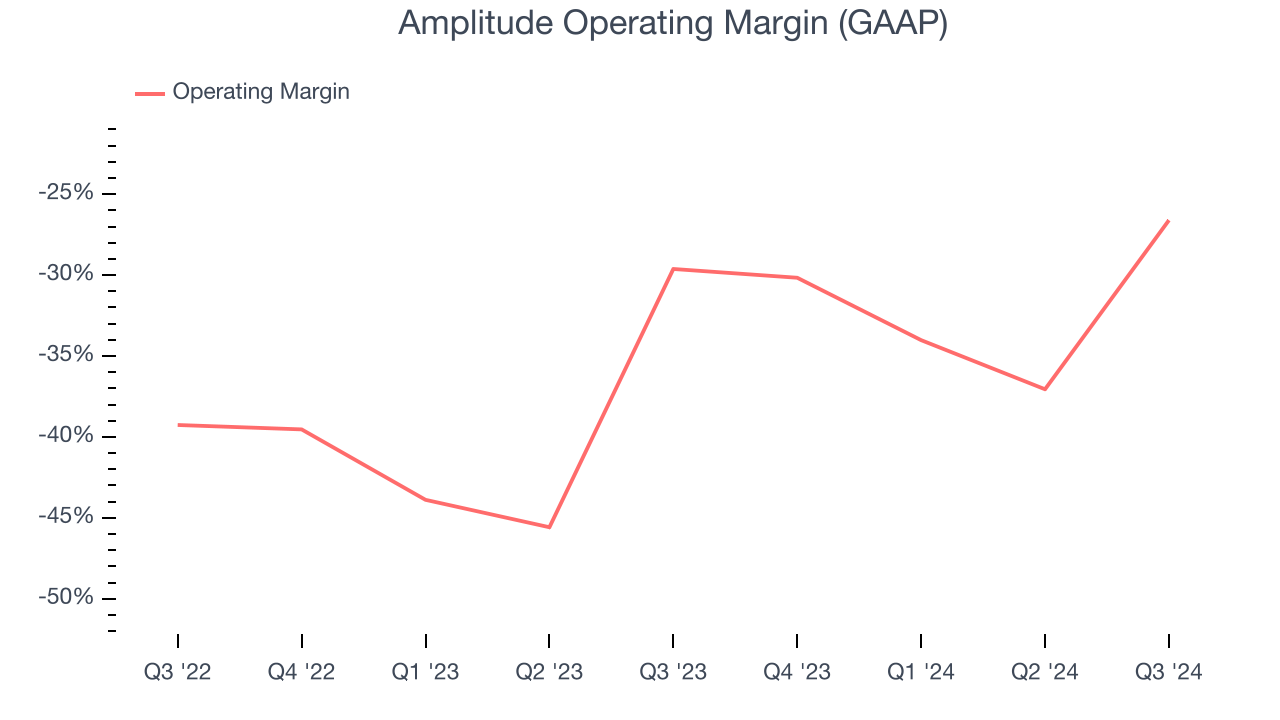
While many software businesses point investors to their adjusted profits, which exclude stock-based compensation (SBC), we prefer GAAP operating margin because SBC is a legitimate expense used to attract and retain talent. This is one of the best measures of profitability because it shows how much money a company takes home after developing, marketing, and selling its products.
Amplitude’s expensive cost structure has contributed to an average operating margin of negative 31.9% over the last year. Unprofitable, high-growth software companies require extra attention because they spend heaps of money to capture market share. As seen in its fast historical revenue growth, this strategy seems to have worked so far, but it’s unclear what would happen if Amplitude reeled back its investments. Wall Street seems to think it will face some obstacles, and we tend to agree.
Final Judgment
Amplitude isn’t a terrible business, but it doesn’t pass our quality test. With its shares topping the market in recent months, the stock trades at 4.4× forward price-to-sales (or $10.85 per share). Investors with a higher risk tolerance might like the company, but we don’t really see a big opportunity at the moment. We're fairly confident there are better investments elsewhere. Let us point you toward Costco, one of Charlie Munger’s all-time favorite businesses.
Stocks We Like More Than Amplitude
With rates dropping, inflation stabilizing, and the elections in the rearview mirror, all signs point to the start of a new bull run - and we’re laser-focused on finding the best stocks for this upcoming cycle.
Put yourself in the driver’s seat by checking out our Top 9 Market-Beating Stocks. This is a curated list of our High Quality stocks that have generated a market-beating return of 175% over the last five years.
Stocks that made our list in 2019 include now familiar names such as Nvidia (+2,691% between September 2019 and September 2024) as well as under-the-radar businesses like Comfort Systems (+783% five-year return). Find your next big winner with StockStory today for free.


