Fashion conglomerate Oxford Industries (NYSE: OXM) missed Wall Street’s revenue expectations in Q3 CY2024, with sales falling 5.7% year on year to $308 million. Next quarter’s revenue guidance of $385 million underwhelmed, coming in 1.1% below analysts’ estimates. Its non-GAAP loss of $0.11 per share was significantly below analysts’ consensus estimates.
Is now the time to buy Oxford Industries? Find out by accessing our full research report, it’s free.
Oxford Industries (OXM) Q3 CY2024 Highlights:
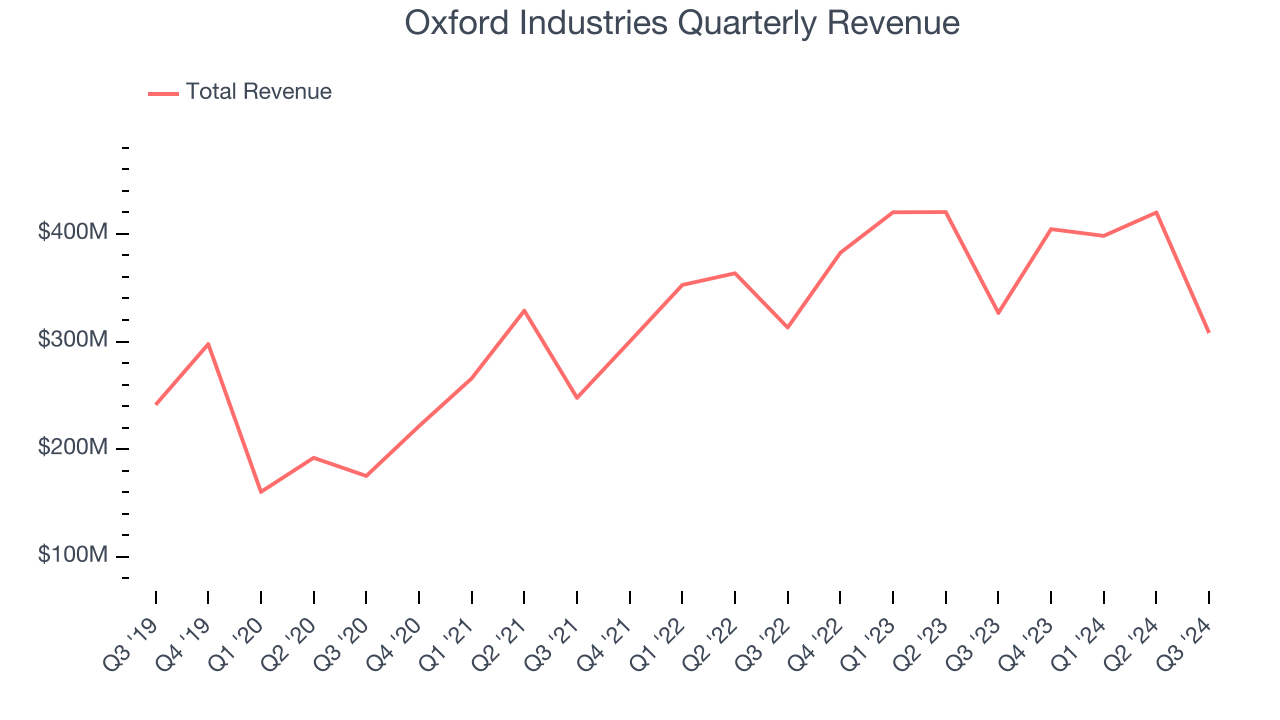
- Revenue: $308 million vs analyst estimates of $316.8 million (5.7% year-on-year decline, 2.8% miss)
- Adjusted EPS: -$0.11 vs analyst estimates of $0.09 (significant miss)
- Revenue Guidance for Q4 CY2024 is $385 million at the midpoint, below analyst estimates of $389.3 million
- Management lowered its full-year Adjusted EPS guidance to $6.60 at the midpoint, a 7.7% decrease
- Operating Margin: -2%, down from 4.4% in the same quarter last year
- Free Cash Flow was -$56.93 million compared to -$6.19 million in the same quarter last year
- Market Capitalization: $1.28 billion
Tom Chubb, Chairman and CEO, commented, “Following a difficult third quarter, we are pleased with the beginning of the holiday season now that some recent headwinds have started to abate. The cumulative effects of several years of high inflation combined with distractions from the U.S. elections and other world events, led to less frequent and more tentative consumer spending behavior during the third quarter which is traditionally our smallest volume quarter of the year. Additionally, our most significant and important market, the Southeastern United States, was impacted by two major hurricanes in quick succession that resulted in estimated lost sales of $4 million and an estimated impact of $0.14 per share. When combined with a highly competitive and promotional environment, these headwinds led to financial performance that was weaker than expected.”
Company Overview
The parent company of Tommy Bahama, Oxford Industries (NYSE: OXM) is a lifestyle fashion conglomerate with brands that embody outdoor happiness.
Apparel and Accessories
Thanks to social media and the internet, not only are styles changing more frequently today than in decades past but also consumers are shifting the way they buy their goods, favoring omnichannel and e-commerce experiences. Some apparel and accessories companies have made concerted efforts to adapt while those who are slower to move may fall behind.
Sales Growth
A company’s long-term sales performance signals its overall quality. Even a bad business can shine for one or two quarters, but a top-tier one grows for years. Regrettably, Oxford Industries’s sales grew at a sluggish 6.4% compounded annual growth rate over the last five years. This was below our standard for the consumer discretionary sector and is a tough starting point for our analysis.
We at StockStory place the most emphasis on long-term growth, but within consumer discretionary, a stretched historical view may miss a company riding a successful new product or trend. Oxford Industries’s annualized revenue growth of 7.3% over the last two years aligns with its five-year trend, suggesting its demand was consistently weak. 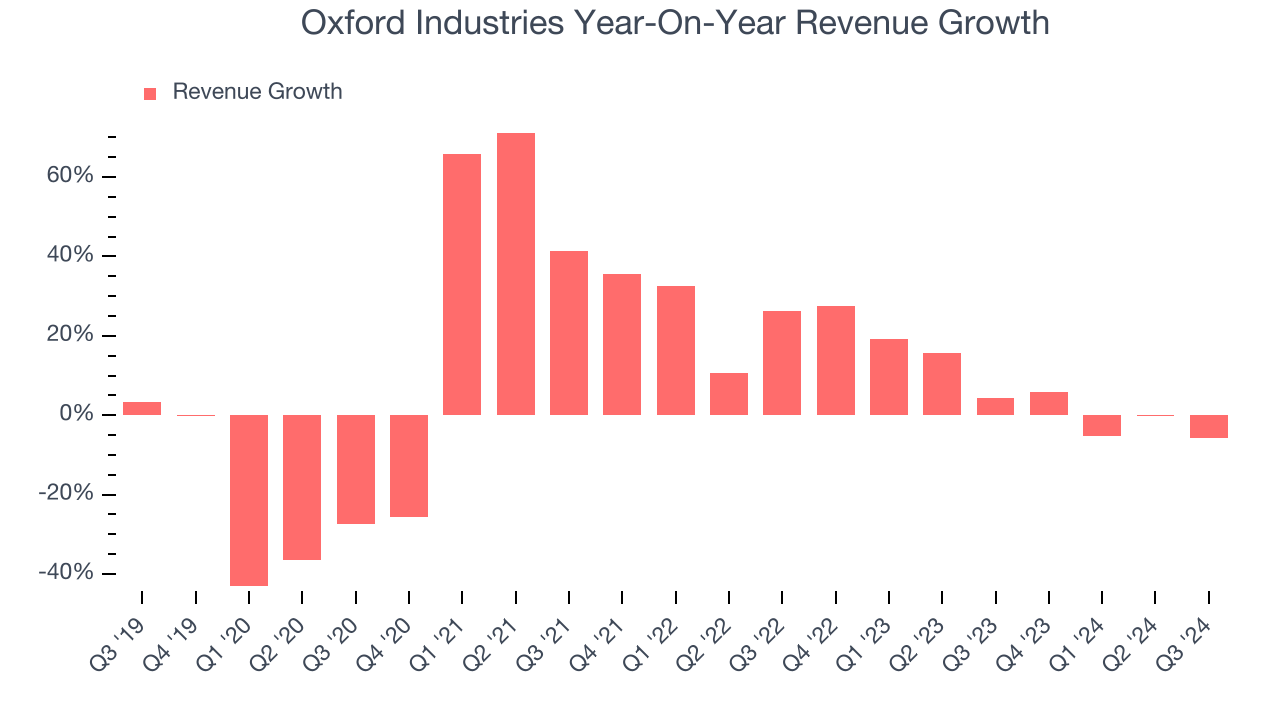
This quarter, Oxford Industries missed Wall Street’s estimates and reported a rather uninspiring 5.7% year-on-year revenue decline, generating $308 million of revenue. Company management is currently guiding for a 4.8% year-on-year decline in sales next quarter.
Looking further ahead, sell-side analysts expect revenue to grow 2.1% over the next 12 months, a deceleration versus the last two years. This projection is underwhelming and suggests its products and services will face some demand challenges.
Software is eating the world and there is virtually no industry left that has been untouched by it. That drives increasing demand for tools helping software developers do their jobs, whether it be monitoring critical cloud infrastructure, integrating audio and video functionality, or ensuring smooth content streaming. Click here to access a free report on our 3 favorite stocks to play this generational megatrend.
Cash Is King
If you’ve followed StockStory for a while, you know we emphasize free cash flow. Why, you ask? We believe that in the end, cash is king, and you can’t use accounting profits to pay the bills.
Oxford Industries has shown weak cash profitability over the last two years, giving the company limited opportunities to return capital to shareholders. Its free cash flow margin averaged 6.7%, subpar for a consumer discretionary business.
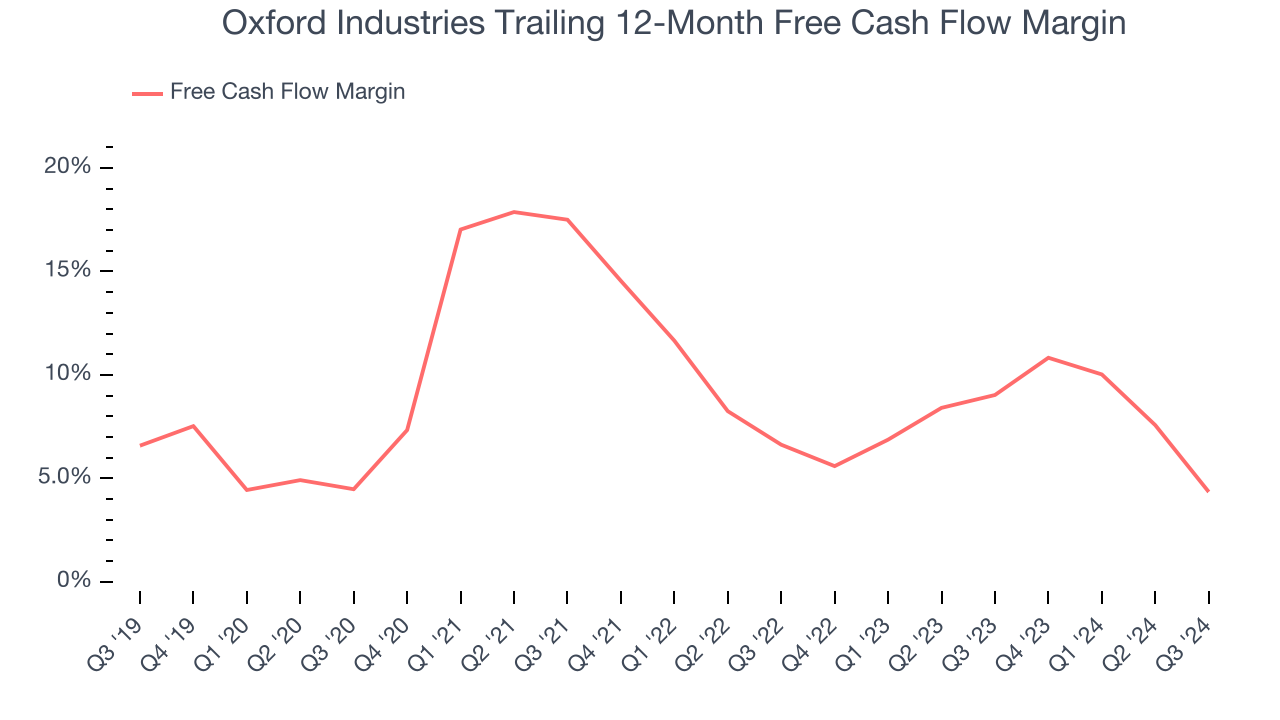
Oxford Industries burned through $56.93 million of cash in Q3, equivalent to a negative 18.5% margin. The company’s cash burn increased from $6.19 million of lost cash in the same quarter last year. These numbers deviate from its longer-term margin, indicating it is a seasonal business that must build up inventory during certain quarters.
Key Takeaways from Oxford Industries’s Q3 Results
We struggled to find many resounding positives in these results as its revenue and EPS missed analysts' expectations. On top of that, its full-year guidance for both metrics fell short of Wall Street’s estimates. Overall, this was a softer quarter. The stock traded down 4.5% to $80.40 immediately following the results.
The latest quarter from Oxford Industries’s wasn’t that good. One earnings report doesn’t define a company’s quality, though, so let’s explore whether the stock is a buy at the current price. The latest quarter does matter, but not nearly as much as longer-term fundamentals and valuation, when deciding if the stock is a buy. We cover that in our actionable full research report which you can read here, it’s free.