Looking back on sit-down dining stocks’ Q3 earnings, we examine this quarter’s best and worst performers, including Denny's (NASDAQ: DENN) and its peers.
Sit-down restaurants offer a complete dining experience with table service. These establishments span various cuisines and are renowned for their warm hospitality and welcoming ambiance, making them perfect for family gatherings, special occasions, or simply unwinding. Their extensive menus range from appetizers to indulgent desserts and wines and cocktails. This space is extremely fragmented and competition includes everything from publicly-traded companies owning multiple chains to single-location mom-and-pop restaurants.
The 12 sit-down dining stocks we track reported a mixed Q3. As a group, revenues missed analysts’ consensus estimates by 0.9%.
In light of this news, share prices of the companies have held steady as they are up 2.3% on average since the latest earnings results.
Weakest Q3: Denny's (NASDAQ: DENN)
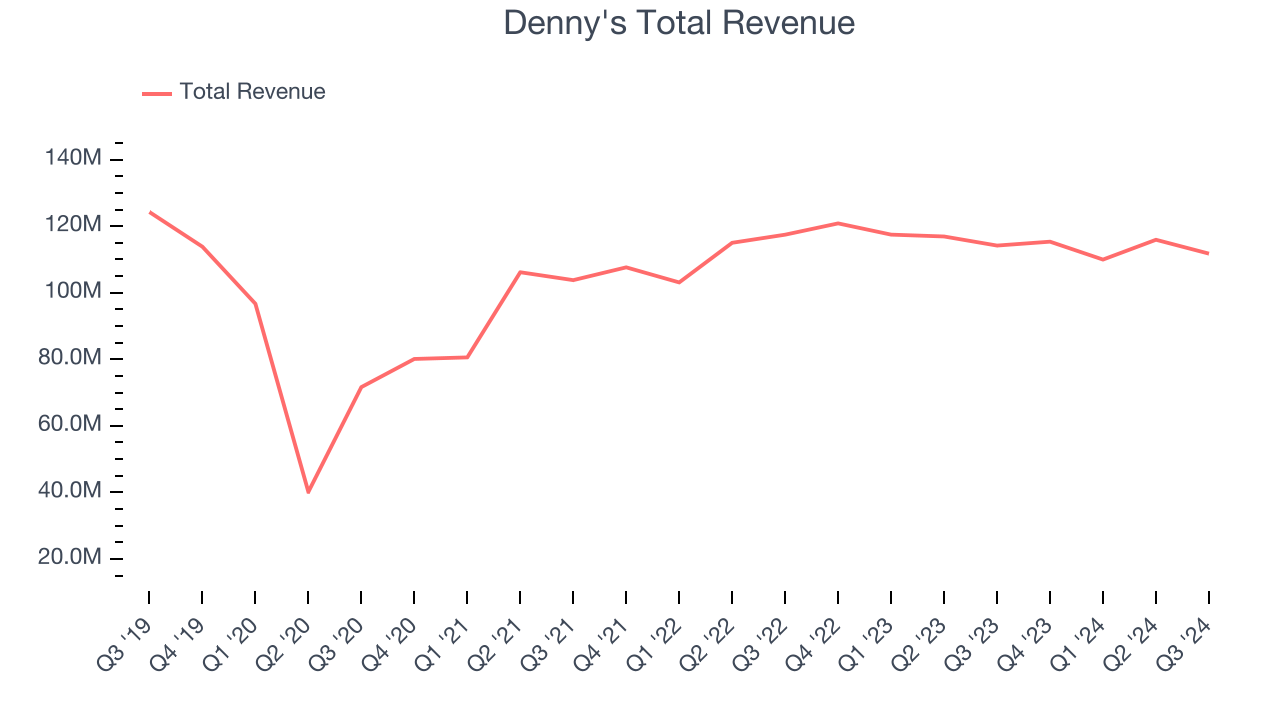
Open around the clock, Denny’s (NASDAQ: DENN) is a chain of diner restaurants serving breakfast and traditional American fare.
Denny's reported revenues of $111.8 million, down 2.1% year on year. This print fell short of analysts’ expectations by 3.2%. Overall, it was a softer quarter for the company with a significant miss of analysts’ EBITDA and EPS estimates.
Kelli Valade, Chief Executive Officer, stated, “Our third quarter sales results directly reflect ongoing brand investments and dedicated focus on value that resulted in outpacing the category. Denny’s domestic system-wide same-restaurant sales** outperformed the BBI Family Dining index for the third consecutive quarter driven by the relaunch of our fan favorite $2-$4-$6-$8 value menu and the continued expansion of off-premises with our third virtual brand, Banda Burrito. Keke’s also experienced significant sequential improvement in same-restaurant sales** as our initiatives to enact foundational marketing strategies and expand the alcohol program continued our efforts to close the gap to the competitive set. We are also very excited to be hosting an Investor Day today.”
Unsurprisingly, the stock is down 5.6% since reporting and currently trades at $6.26.
Read our full report on Denny's here, it’s free.
Best Q3: Brinker International (NYSE: EAT)
Founded by Norman Brinker in Dallas, Texas, Brinker International (NYSE: EAT) is a casual restaurant chain that operates under the Chili’s, Maggiano’s Little Italy, and It’s Just Wings banners.
Brinker International reported revenues of $1.14 billion, up 12.5% year on year, outperforming analysts’ expectations by 3.4%. The business had a stunning quarter with an impressive beat of analysts’ EBITDA estimates and a solid beat of analysts’ same-store sales estimates.
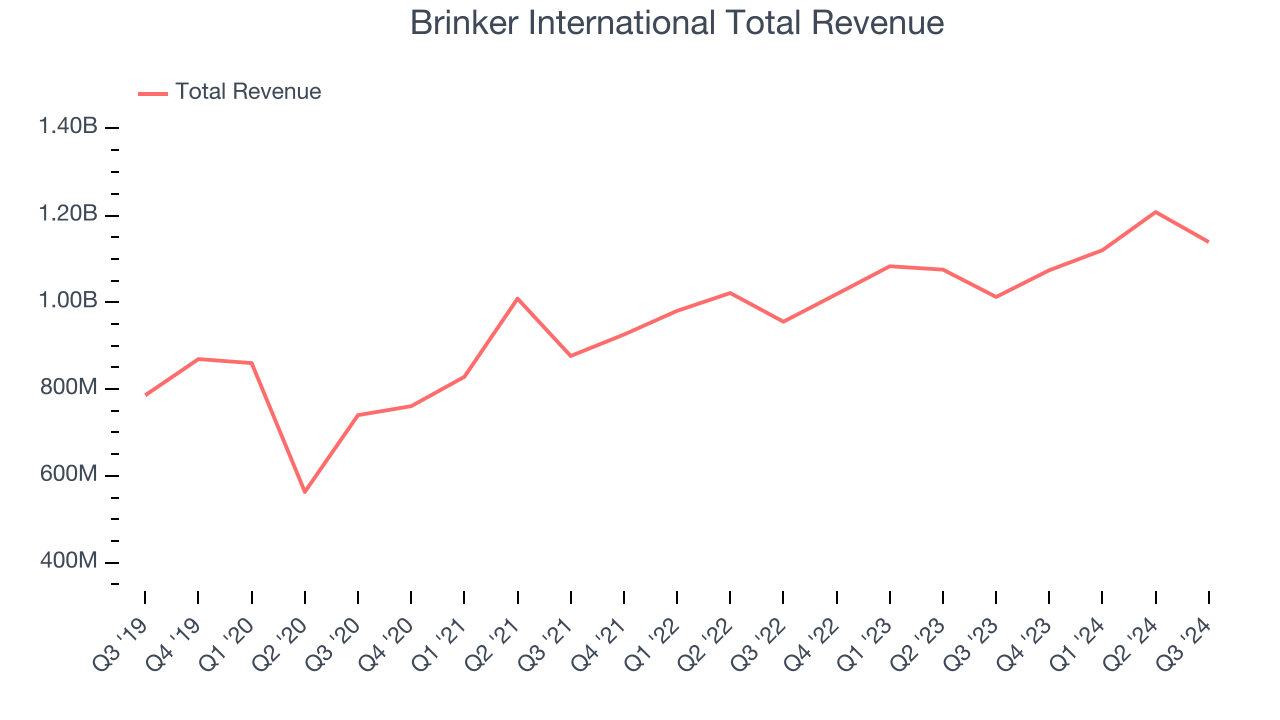
Brinker International scored the biggest analyst estimates beat and highest full-year guidance raise among its peers. The market seems happy with the results as the stock is up 34.7% since reporting. It currently trades at $131.
Is now the time to buy Brinker International? Access our full analysis of the earnings results here, it’s free.
The ONE Group (NASDAQ: STKS)
Doubling as a hospitality services provider for hotels and resorts, The One Group Hospitality (NASDAQ: STKS) is an upscale restaurant company that operates STK Steakhouse and Kona Grill.
The ONE Group reported revenues of $194 million, up 152% year on year, falling short of analysts’ expectations by 10%. It was a softer quarter as it posted full-year revenue guidance missing analysts’ expectations.
The ONE Group delivered the fastest revenue growth but had the weakest performance against analyst estimates and weakest full-year guidance update in the group. As expected, the stock is down 17.2% since the results and currently trades at $3.25.
Read our full analysis of The ONE Group’s results here.
Dine Brands (NYSE: DIN)
Operating a franchise model, Dine Brands (NYSE: DIN) is a casual restaurant chain that owns the Applebee’s and IHOP banners.
Dine Brands reported revenues of $195 million, down 3.7% year on year. This result missed analysts’ expectations by 1.7%. Taking a step back, it was a mixed quarter as it also recorded an impressive beat of analysts’ EBITDA estimates but a miss of analysts’ same-store sales estimates.
The stock is up 2.1% since reporting and currently trades at $31.82.
Read our full, actionable report on Dine Brands here, it’s free.
Red Robin (NASDAQ: RRGB)
Known for its bottomless steak fries, Red Robin (NASDAQ: RRGB) is a chain of casual restaurants specializing in burgers and general American fare.
Red Robin reported revenues of $274.6 million, down 1.1% year on year. This print surpassed analysts’ expectations by 1.4%. Zooming out, it was a softer quarter as it recorded full-year EBITDA guidance missing analysts’ expectations.
The stock is down 7.4% since reporting and currently trades at $5.68.
Read our full, actionable report on Red Robin here, it’s free.
Market Update
Thanks to the Fed’s rate hikes in 2022 and 2023, inflation has been on a steady path downward, easing back toward that 2% sweet spot. Fortunately (miraculously to some), all this tightening didn’t send the economy tumbling into a recession, so here we are, cautiously celebrating a soft landing. The cherry on top? Recent rate cuts (half a point in September, a quarter in November) have kept 2024 stock markets frothy, especially after Trump’s November win lit a fire under major indices and sent them to all-time highs. However, there's still plenty to ponder — tariffs, corporate tax cuts, and what 2025 might hold for the economy.
Want to invest in winners with rock-solid fundamentals? Check out our Strong Momentum Stocks and add them to your watchlist. These companies are poised for growth regardless of the political or macroeconomic climate.
Join Paid Stock Investor Research
Help us make StockStory more helpful to investors like yourself. Join our paid user research session and receive a $50 Amazon gift card for your opinions. Sign up here.