
Clarus has gotten torched over the last six months - since June 2024, its stock price has dropped 26.5% to $4.98 per share. This was partly driven by its softer quarterly results and may have investors wondering how to approach the situation.
Is now the time to buy Clarus, or should you be careful about including it in your portfolio? See what our analysts have to say in our full research report, it’s free.Despite the more favorable entry price, we don't have much confidence in Clarus. Here are three reasons why CLAR doesn't excite us and a stock we'd rather own.
Why Do We Think Clarus Will Underperform?
Initially a financial services business, Clarus (NASDAQ: CLAR) designs, manufactures, and distributes outdoor equipment and lifestyle products.
1. Long-Term Revenue Growth Disappoints
A company’s long-term performance is an indicator of its overall quality. While any business can experience short-term success, top-performing ones enjoy sustained growth for years. Over the last five years, Clarus grew its sales at a sluggish 3.6% compounded annual growth rate. This fell short of our benchmark for the consumer discretionary sector. 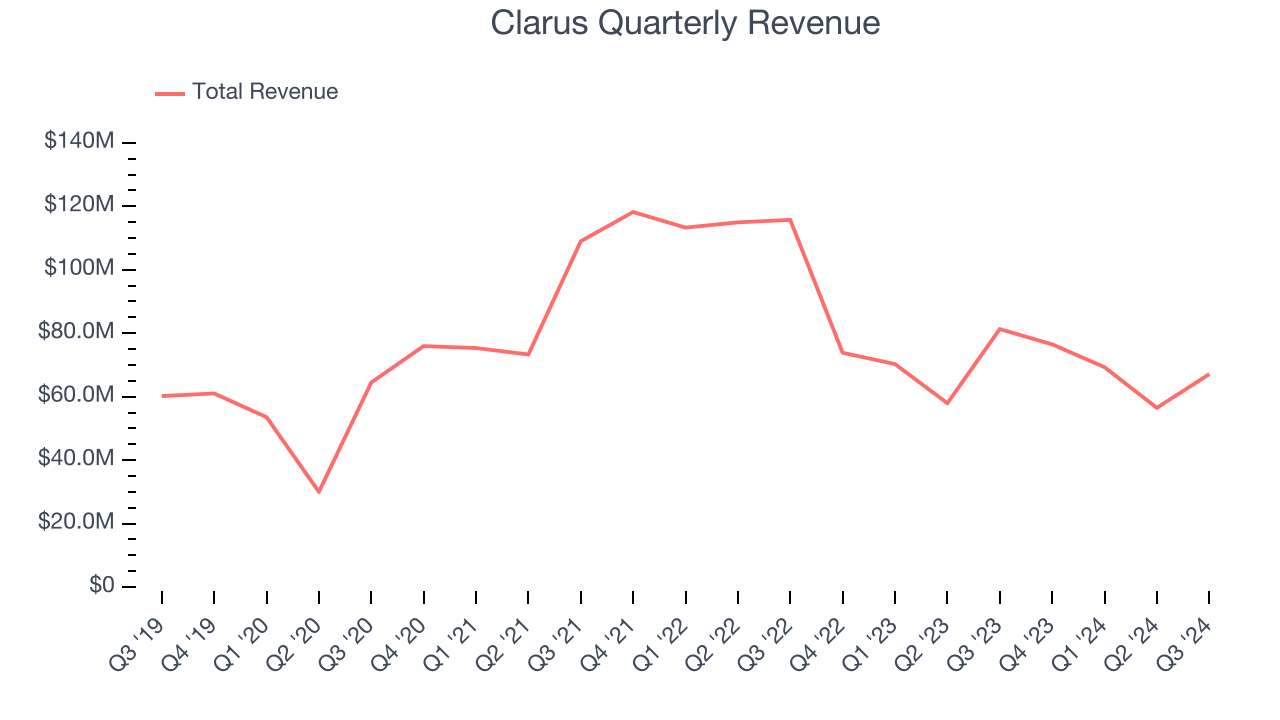
2. EPS Trending Down
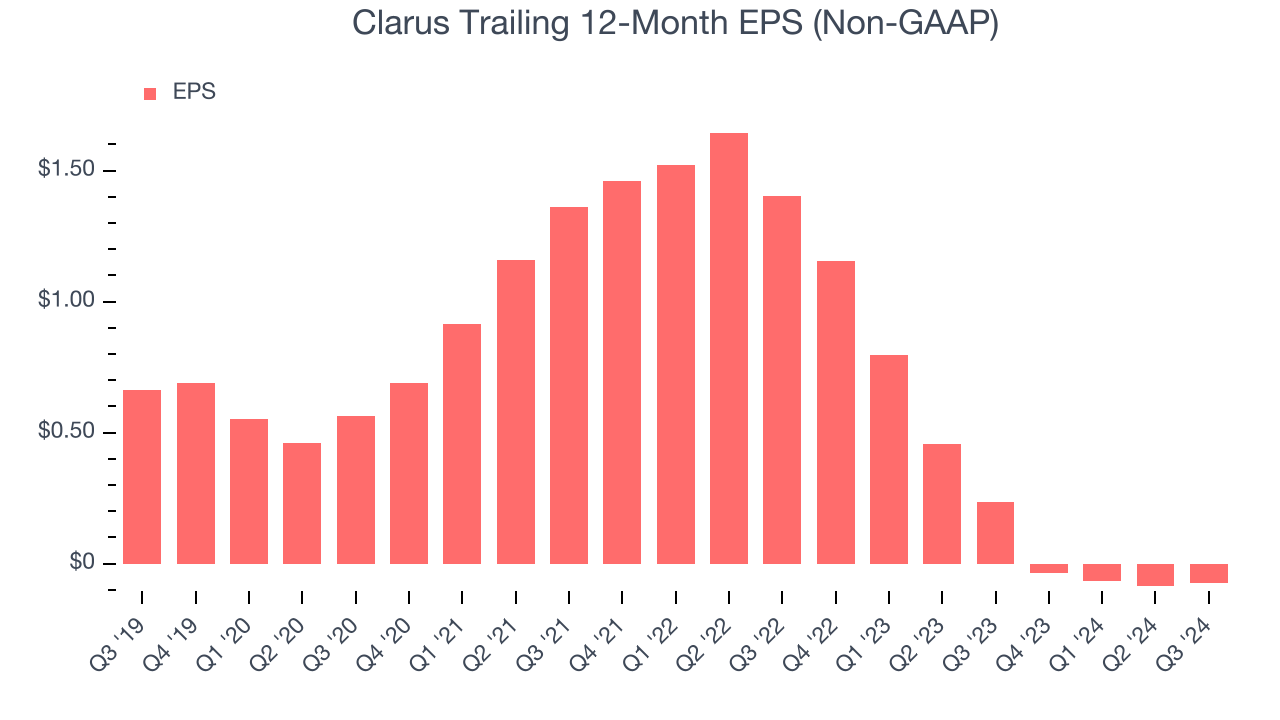
Analyzing the long-term change in earnings per share (EPS) shows whether a company's incremental sales were profitable – for example, revenue could be inflated through excessive spending on advertising and promotions.
Sadly for Clarus, its EPS declined by 16.1% annually over the last five years while its revenue grew by 3.6%. This tells us the company became less profitable on a per-share basis as it expanded.
3. New Investments Fail to Bear Fruit as ROIC Declines
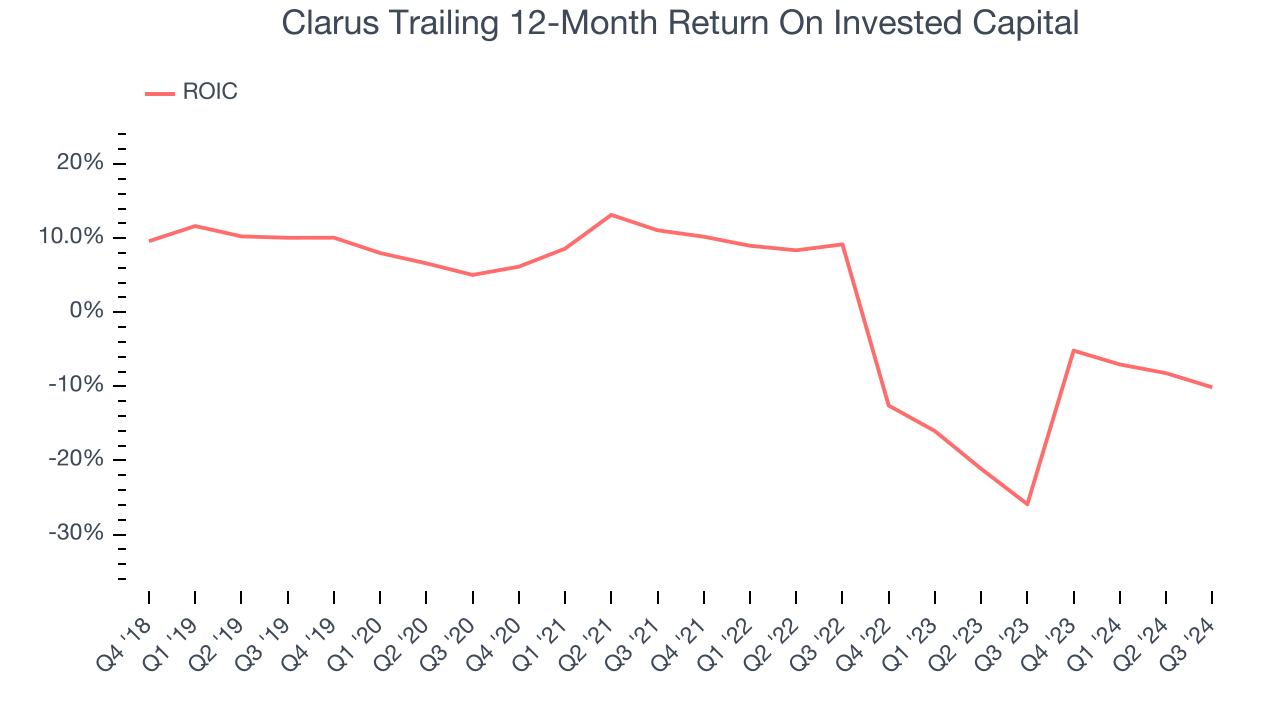
ROIC, or return on invested capital, is a metric showing how much operating profit a company generates relative to the money it has raised (debt and equity).
We typically prefer to invest in companies with high returns because it means they have viable business models, but the trend in a company’s ROIC is often what surprises the market and moves the stock price. Clarus’s ROIC has decreased significantly over the last few years. Paired with its already low returns, these declines suggest its profitable growth opportunities are few and far between.
Final Judgment
We cheer for all companies serving everyday consumers, but in the case of Clarus, we’ll be cheering from the sidelines. After the recent drawdown, the stock trades at 11.6× forward price-to-earnings (or $4.98 per share). While this valuation is fair, the upside isn’t great compared to the potential downside. There are superior stocks to buy right now. Let us point you toward KLA Corporation, a picks and shovels play for semiconductor manufacturing.
Stocks We Like More Than Clarus
The elections are now behind us. With rates dropping and inflation cooling, many analysts expect a breakout market to cap off the year - and we’re zeroing in on the stocks that could benefit immensely.
Take advantage of the rebound by checking out our Top 5 Strong Momentum Stocks for this week. This is a curated list of our High Quality stocks that have generated a market-beating return of 175% over the last five years.
Stocks that made our list in 2019 include now familiar names such as Nvidia (+2,691% between September 2019 and September 2024) as well as under-the-radar businesses like United Rentals (+550% five-year return). Find your next big winner with StockStory today for free.


