Wrapping up Q3 earnings, we look at the numbers and key takeaways for the maintenance and repair distributors stocks, including Distribution Solutions (NASDAQ: DSGR) and its peers.
Supply chain and inventory management are themes that grew in focus after COVID wreaked havoc on the global movement of raw materials and components. Maintenance and repair distributors that boast reliable selection and quickly deliver products to customers can benefit from this theme. While e-commerce hasn’t disrupted industrial distribution as much as consumer retail, it is still a real threat, forcing investment in omnichannel capabilities to serve customers everywhere. Additionally, maintenance and repair distributors are at the whim of economic cycles that impact the capital spending and construction projects that can juice demand.
The 8 maintenance and repair distributors stocks we track reported a slower Q3. As a group, revenues were in line with analysts’ consensus estimates.
Thankfully, share prices of the companies have been resilient as they are up 6.7% on average since the latest earnings results.
Distribution Solutions (NASDAQ: DSGR)
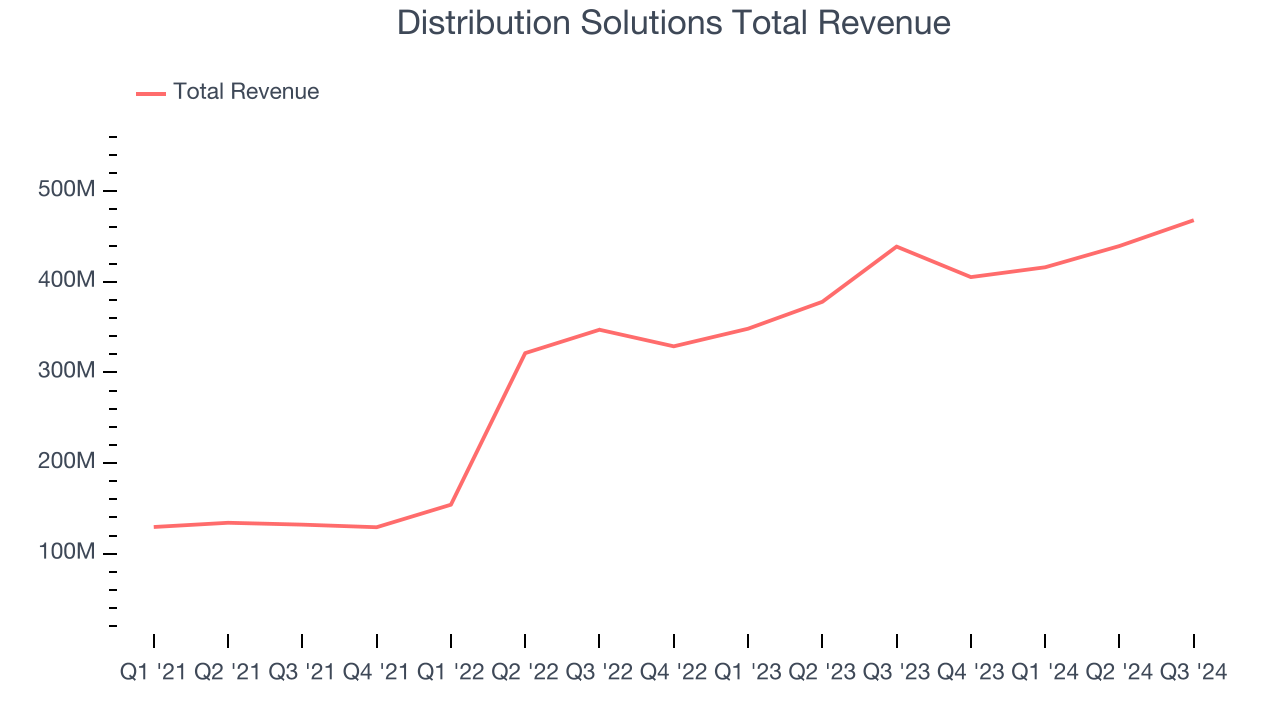
Founded in 1952, Distribution Solutions (NASDAQ: DSGR) provides supply chain solutions and distributes industrial, safety, and maintenance products to various industries.
Distribution Solutions reported revenues of $468 million, up 6.6% year on year. This print exceeded analysts’ expectations by 1.2%. Despite the top-line beat, it was still a mixed quarter for the company with an impressive beat of analysts’ EBITDA estimates but a significant miss of analysts’ EPS estimates.
Bryan King, CEO and Chairman of the Board, said, "We are pleased with DSG’s third quarter results, which delivered sales and profitability growth over the prior-year quarter."
Unsurprisingly, the stock is down 3.9% since reporting and currently trades at $38.49.
Is now the time to buy Distribution Solutions? Access our full analysis of the earnings results here, it’s free.
Best Q3: DXP (NASDAQ: DXPE)
Founded during the emergence of Big Oil in Texas, DXP (NASDAQ: DXPE) provides pumps, valves, and other industrial components.
DXP reported revenues of $472.9 million, up 12.8% year on year, outperforming analysts’ expectations by 6.8%. The business had an incredible quarter with a solid beat of analysts’ EPS estimates and an impressive beat of analysts’ EBITDA estimates.
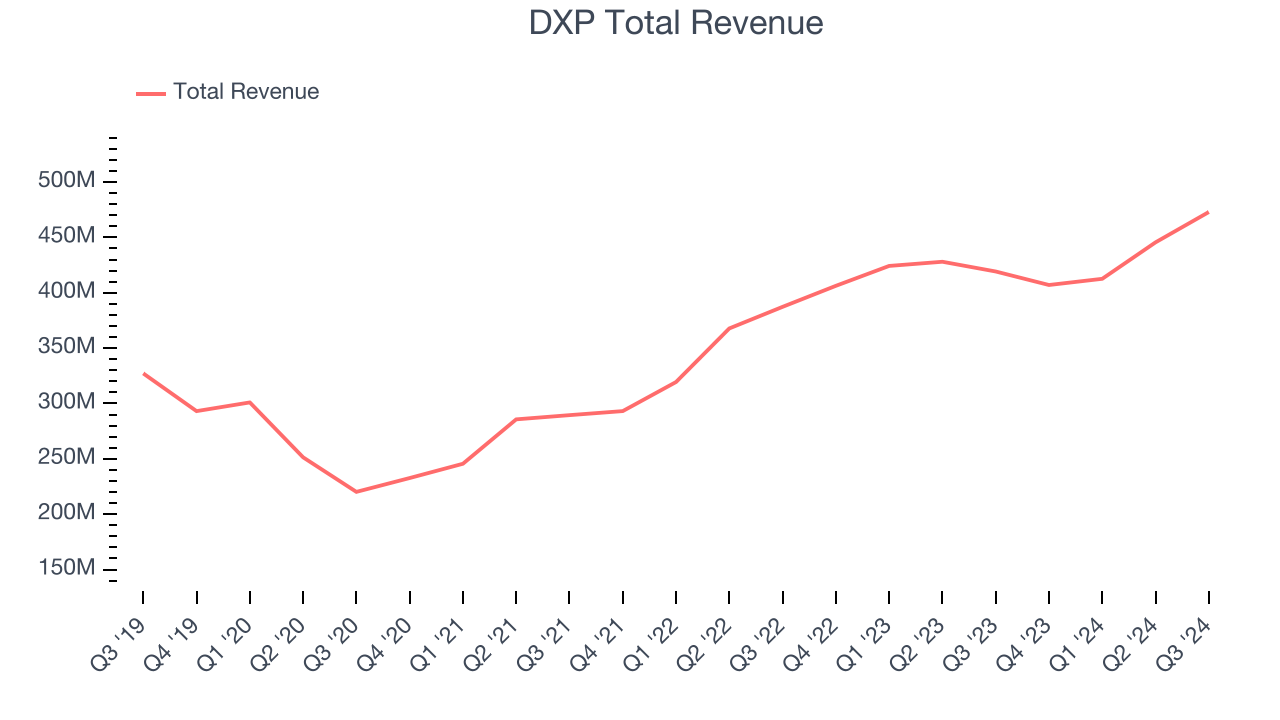
DXP delivered the biggest analyst estimates beat and fastest revenue growth among its peers. The market seems happy with the results as the stock is up 54% since reporting. It currently trades at $78.41.
Is now the time to buy DXP? Access our full analysis of the earnings results here, it’s free.
Weakest Q3: Global Industrial (NYSE: GIC)
Formerly known as Systemax, Global Industrial (NYSE: GIC) distributes industrial and commercial products to businesses and institutions.
Global Industrial reported revenues of $342.4 million, down 3.4% year on year, falling short of analysts’ expectations by 3.1%. It was a disappointing quarter as it posted a significant miss of analysts’ EBITDA and EPS estimates.
As expected, the stock is down 17.3% since the results and currently trades at $27.35.
Read our full analysis of Global Industrial’s results here.
WESCO (NYSE: WCC)
Based in Pittsburgh, WESCO (NYSE: WCC) provides electrical, industrial, and communications products and augments them with services such as supply chain management.
WESCO reported revenues of $5.49 billion, down 2.7% year on year. This print was in line with analysts’ expectations. Taking a step back, it was a satisfactory quarter as it also logged an impressive beat of analysts’ EPS estimates but organic revenue in line with analysts’ estimates.
The stock is up 10.4% since reporting and currently trades at $196.40.
Read our full, actionable report on WESCO here, it’s free.
W.W. Grainger (NYSE: GWW)
Founded as a supplier of motors, W.W. Grainger (NYSE: GWW) provides maintenance, repair, and operating (MRO) supplies and services to businesses and institutions.
W.W. Grainger reported revenues of $4.39 billion, up 4.3% year on year. This print met analysts’ expectations. Aside from that, it was a mixed quarter as it also produced full-year EPS guidance slightly topping analysts’ expectations but a slight miss of analysts’ organic revenue estimates.
The stock is up 5.7% since reporting and currently trades at $1,164.
Read our full, actionable report on W.W. Grainger here, it’s free.
Market Update
Thanks to the Fed's series of rate hikes in 2022 and 2023, inflation has cooled significantly from its post-pandemic highs, drawing closer to the 2% goal. This disinflation has occurred without severely impacting economic growth, suggesting the success of a soft landing. The stock market has thrived in 2024, spurred by recent rate cuts (0.5% in September and 0.25% in November), and a notable surge followed Donald Trump’s presidential election win in November, propelling indices to historic highs. Nonetheless, the outlook for 2025 remains clouded by potential trade policy changes and corporate tax discussions, which could impact business confidence and growth. The path forward holds both optimism and caution as new policies take shape.
Want to invest in winners with rock-solid fundamentals? Check out our 9 Best Market-Beating Stocks and add them to your watchlist. These companies are poised for growth regardless of the political or macroeconomic climate.
Join Paid Stock Investor Research
Help us make StockStory more helpful to investors like yourself. Join our paid user research session and receive a $50 Amazon gift card for your opinions. Sign up here.