Since December 2019, the S&P 500 has delivered a total return of 89.1%. But one standout stock has nearly doubled the market - over the past five years, AECOM has surged 159% to $111.51 per share. Its momentum hasn’t stopped as it’s also gained 26% in the last six months, beating the S&P by 15.6%.
Is now the time to buy AECOM, or should you be careful about including it in your portfolio? Dive into our full research report to see our analyst team’s opinion, it’s free.We’re happy investors have made money, but we're cautious about AECOM. Here are three reasons why you should be careful with ACM and a stock we'd rather own.
Why Is AECOM Not Exciting?
Founded in 1990 when a group of engineers from five companies decided to merge, AECOM (NYSE: ACM) provides various infrastructure consulting services.
1. Long-Term Revenue Growth Disappoints
Reviewing a company’s long-term sales performance reveals insights into its quality. Any business can have short-term success, but a top-tier one grows for years. Over the last five years, AECOM grew its sales at a sluggish 3.4% compounded annual growth rate. This fell short of our benchmark for the industrials sector. 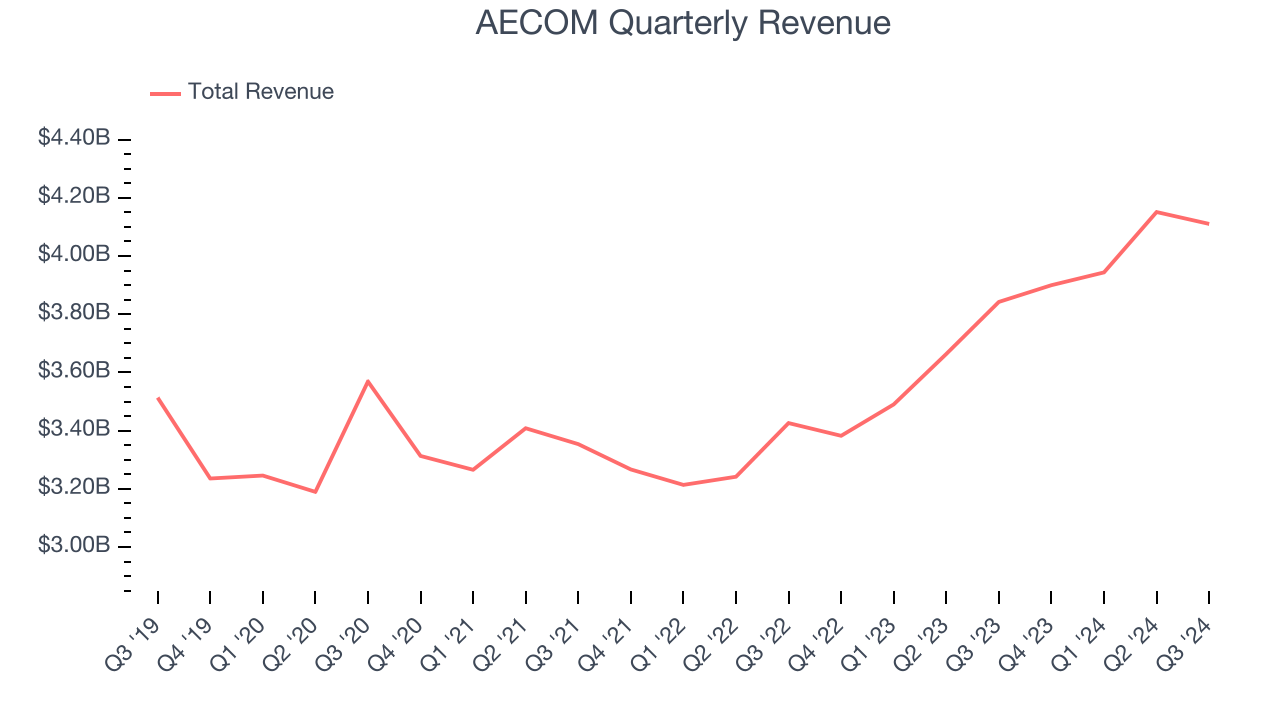
2. Backlog Is Unchanged, Sales Pipeline Stalls
Investors interested in Engineering and Design Services companies should track backlog in addition to reported revenue. This metric shows the value of outstanding orders that have not yet been executed or delivered, giving visibility into AECOM’s future revenue streams.
Over the last two years, AECOM failed to grow its backlog, which came in at $23.86 billion in the latest quarter. This performance was underwhelming and shows the company faced challenges in winning new orders. It also suggests there may be increasing competition or market saturation. 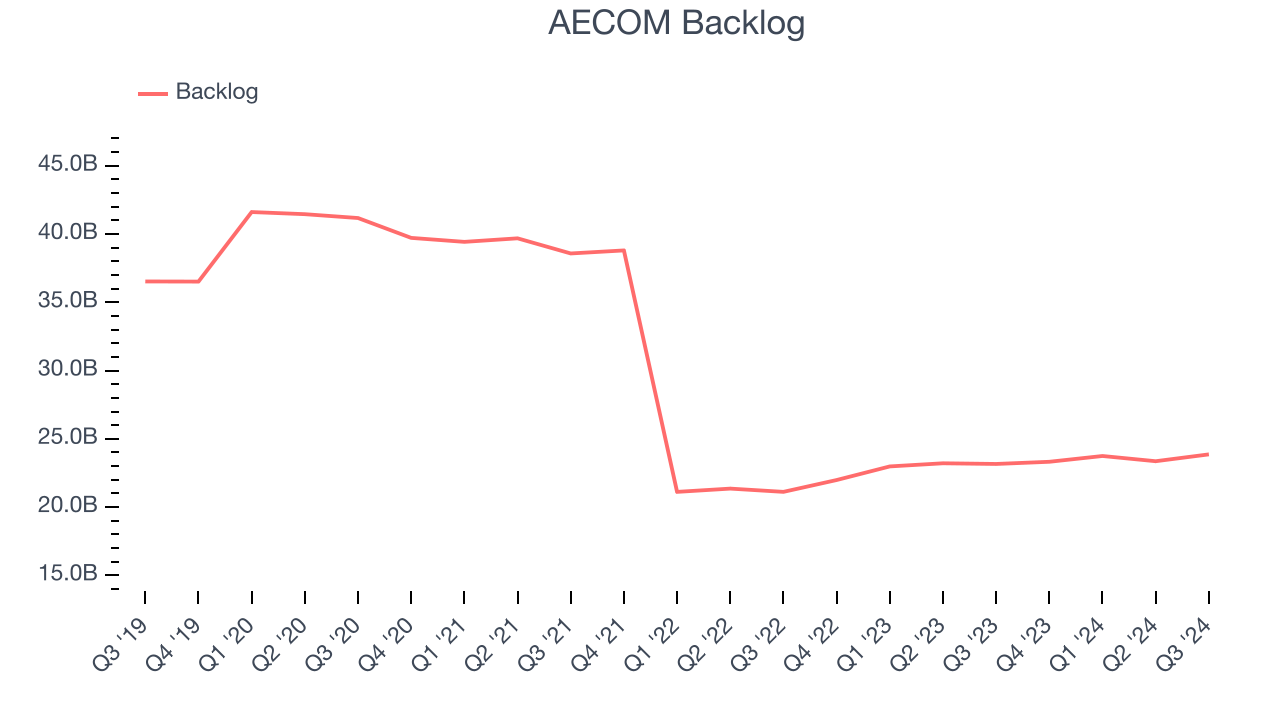
3. Low Gross Margin Reveals Weak Structural Profitability
All else equal, we prefer higher gross margins because they usually indicate that a company sells more differentiated products and commands stronger pricing power.
AECOM has bad unit economics for an industrials business, signaling it operates in a competitive market. As you can see below, it averaged a 6.2% gross margin over the last five years. That means AECOM paid its suppliers a lot of money ($93.75 for every $100 in revenue) to run its business. 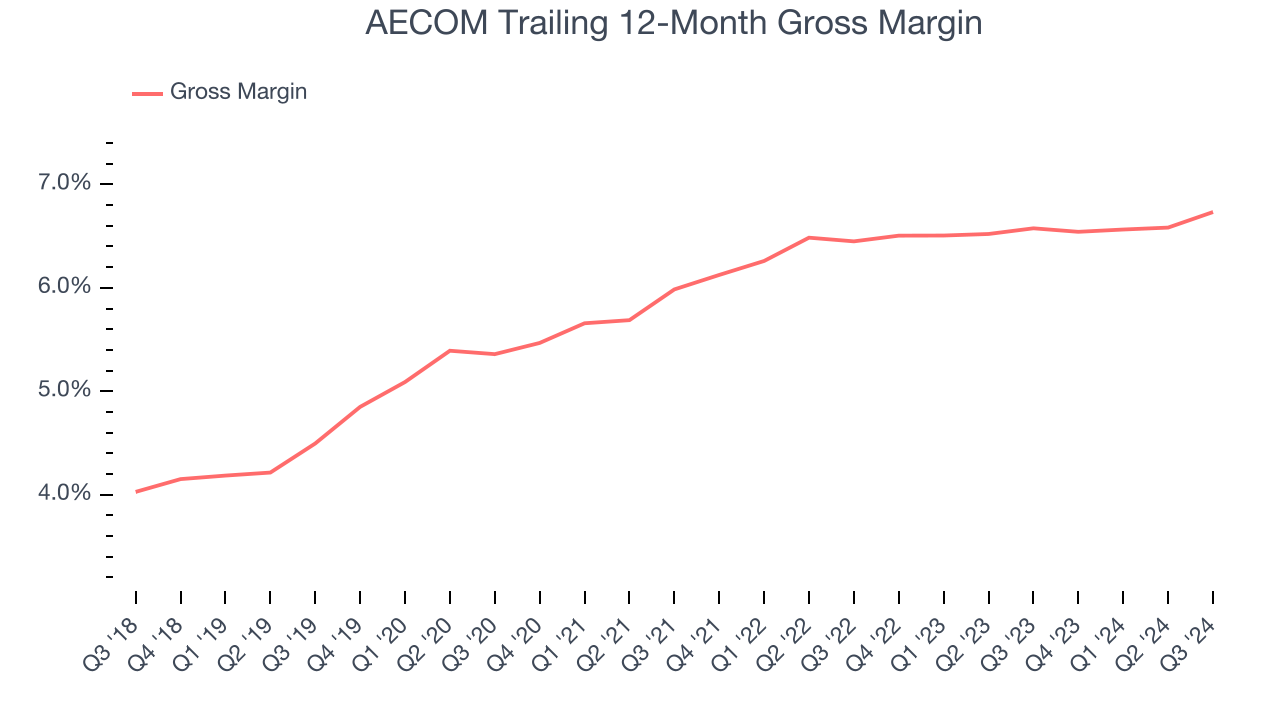
Final Judgment
AECOM isn’t a terrible business, but it doesn’t pass our quality test. With its shares outperforming the market lately, the stock trades at 22.5× forward price-to-earnings (or $111.51 per share). Beauty is in the eye of the beholder, but we don’t really see a big opportunity at the moment. We're pretty confident there are more exciting stocks to buy at the moment. Let us point you toward Microsoft, the most dominant software business in the world.
Stocks We Like More Than AECOM
The Trump trade may have passed, but rates are still dropping and inflation is still cooling. Opportunities are ripe for those ready to act - and we’re here to help you pick them.
Get started by checking out our Top 5 Growth Stocks for this month. This is a curated list of our High Quality stocks that have generated a market-beating return of 175% over the last five years.
Stocks that made our list in 2019 include now familiar names such as Nvidia (+2,691% between September 2019 and September 2024) as well as under-the-radar businesses like Comfort Systems (+783% five-year return). Find your next big winner with StockStory today for free.