
What a brutal six months it’s been for Blink Charging. The stock has dropped 46.3% and now trades at $1.57, rattling many shareholders. This was partly driven by its softer quarterly results and may have investors wondering how to approach the situation.
Is there a buying opportunity in Blink Charging, or does it present a risk to your portfolio? See what our analysts have to say in our full research report, it’s free.Even with the cheaper entry price, we're cautious about Blink Charging. Here are three reasons why we avoid BLNK and a stock we'd rather own.
Why Is Blink Charging Not Exciting?
One of the first EV charging companies to go public, Blink Charging (NASDAQ: BLNK) is a manufacturer, owner, operator, and provider of electric vehicle charging equipment and networked EV charging services.
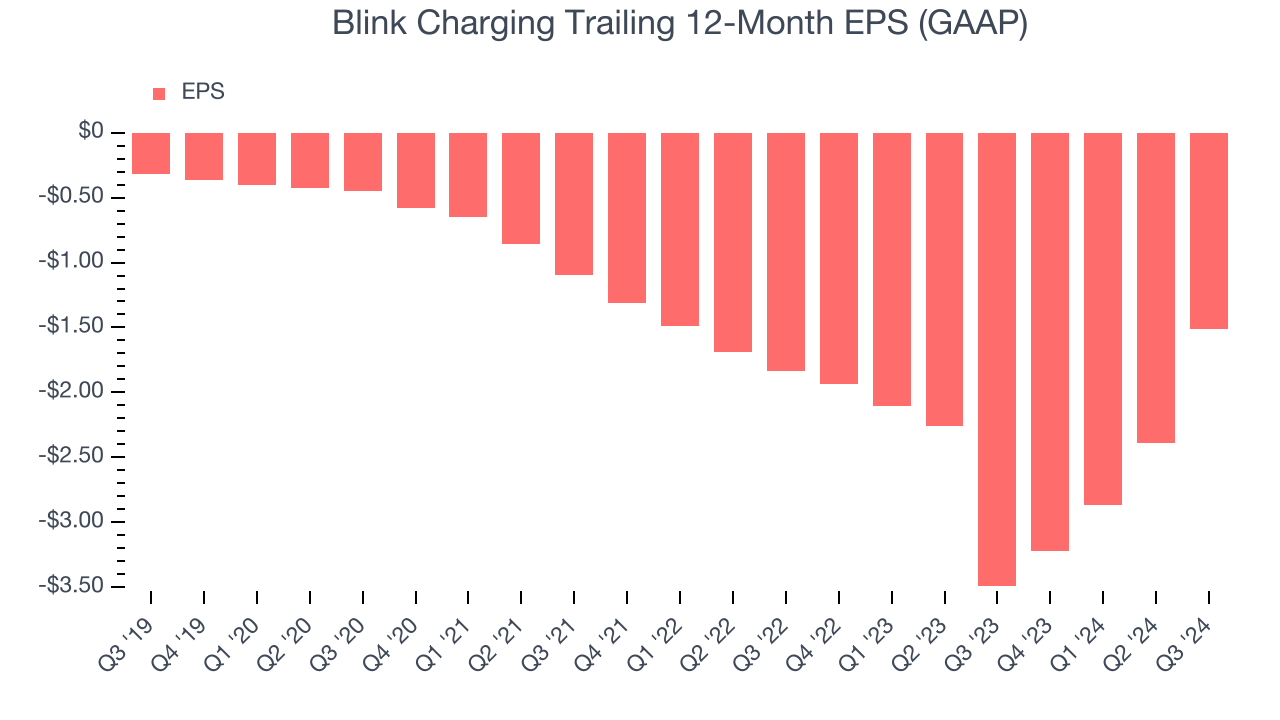
1. EPS Trending Down
We track the long-term change in earnings per share (EPS) because it highlights whether a company’s growth is profitable.
Blink Charging’s earnings losses deepened over the last five years as its EPS dropped 36.3% annually. We’ll keep a close eye on the company as diminishing earnings could imply changing secular trends and preferences.
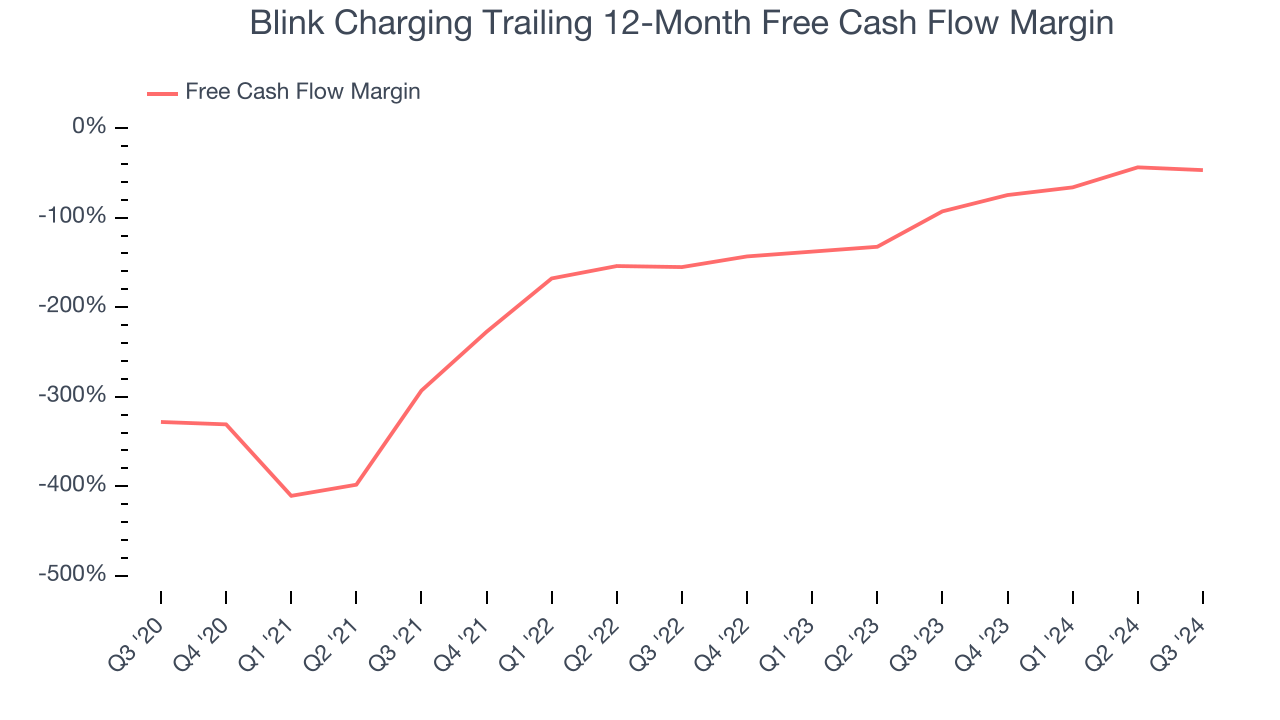
2. Cash Burn Ignites Concerns
If you’ve followed StockStory for a while, you know we emphasize free cash flow. Why, you ask? We believe that in the end, cash is king, and you can’t use accounting profits to pay the bills.
Blink Charging’s demanding reinvestments have drained its resources over the last five years, putting it in a pinch and limiting its ability to return capital to investors. Its free cash flow margin averaged negative 95%, meaning it lit $94.97 of cash on fire for every $100 in revenue.
3. Short Cash Runway Exposes Shareholders to Potential Dilution
As long-term investors, the risk we care about most is the permanent loss of capital, which can happen when a company goes bankrupt or raises money from a disadvantaged position. This is separate from short-term stock price volatility, something we are much less bothered by.
Blink Charging burned through $65.1 million of cash over the last year. With $64.58 million of cash and $7.83 million of debt on its balance sheet, the company has around 10 months of runway left.
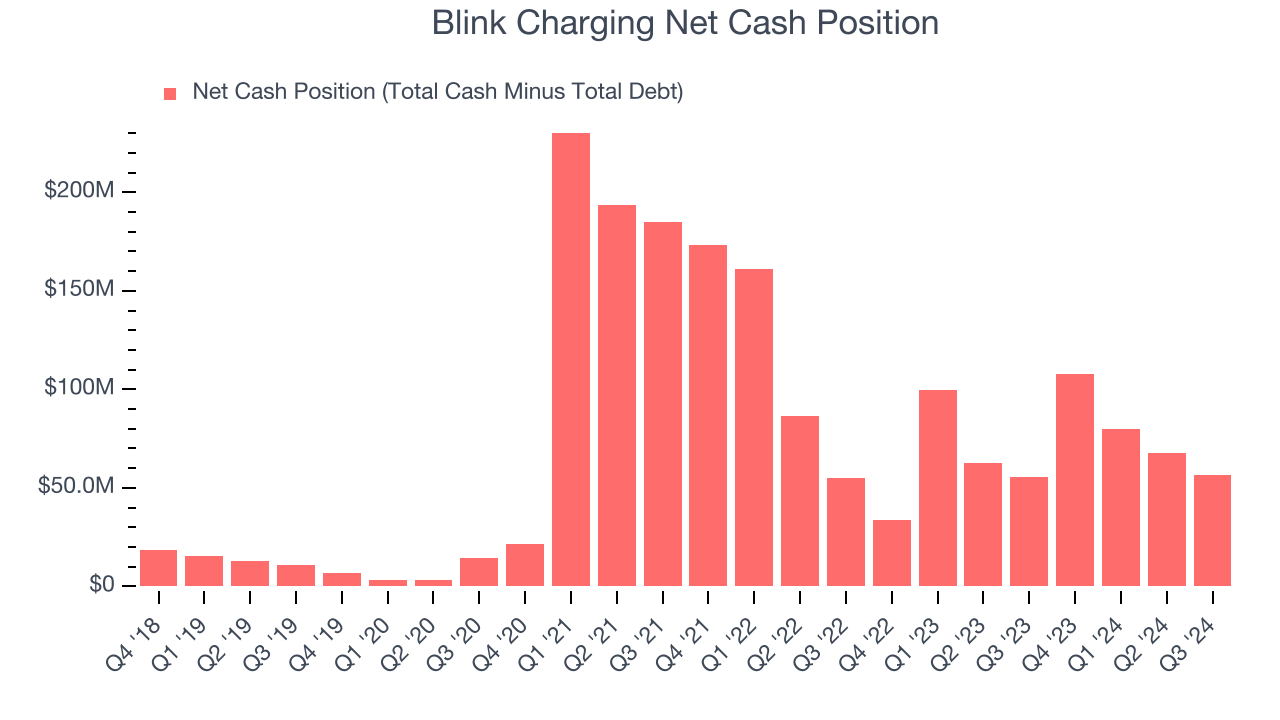
Unless the Blink Charging’s fundamentals change quickly, it might find itself in a position where it must raise capital from investors to continue operating. Whether that would be favorable is unclear because dilution is a headwind for shareholder returns.
We remain cautious of Blink Charging until it generates consistent free cash flow or any of its announced financing plans materialize on its balance sheet.
Final Judgment
Blink Charging’s business quality ultimately falls short of our standards. Following the recent decline, the stock trades at $1.57 per share (or 0.9× forward price-to-sales). The market typically values companies like Blink Charging based on their anticipated profits for the next 12 months, but it expects the business to lose money. We also think the upside isn’t great compared to the potential downside here - there are more exciting stocks to buy. We’d recommend looking at Microsoft, the most dominant software business in the world.
Stocks We Would Buy Instead of Blink Charging
With rates dropping, inflation stabilizing, and the elections in the rearview mirror, all signs point to the start of a new bull run - and we’re laser-focused on finding the best stocks for this upcoming cycle.
Put yourself in the driver’s seat by checking out our Top 6 Stocks for this week. This is a curated list of our High Quality stocks that have generated a market-beating return of 175% over the last five years.
Stocks that made our list in 2019 include now familiar names such as Nvidia (+2,691% between September 2019 and September 2024) as well as under-the-radar businesses like United Rentals (+550% five-year return). Find your next big winner with StockStory today for free.
