Over the past six months, Terex’s stock price fell to $49.55. Shareholders have lost 7.8% of their capital, which is disappointing considering the S&P 500 has climbed by 10.4%. This may have investors wondering how to approach the situation.
Following the drawdown, is now the time to buy TEX? Find out in our full research report, it’s free.
Why Does TEX Stock Spark Debate?
With humble beginnings as a dump truck company, Terex (NYSE: TEX) today manufactures lifting and material handling equipment designed to move and hoist heavy goods and materials.
Two Positive Attributes:
1. Core Business Firing on All Cylinders
We can better understand Construction Machinery companies by analyzing their organic revenue. This metric gives visibility into Terex’s core business because it excludes one-time events such as mergers, acquisitions, and divestitures along with foreign currency fluctuations - non-fundamental factors that can manipulate the income statement.
Over the last two years, Terex’s organic revenue averaged 11.7% year-on-year growth. This performance was impressive and shows it can expand quickly without relying on expensive (and risky) acquisitions. 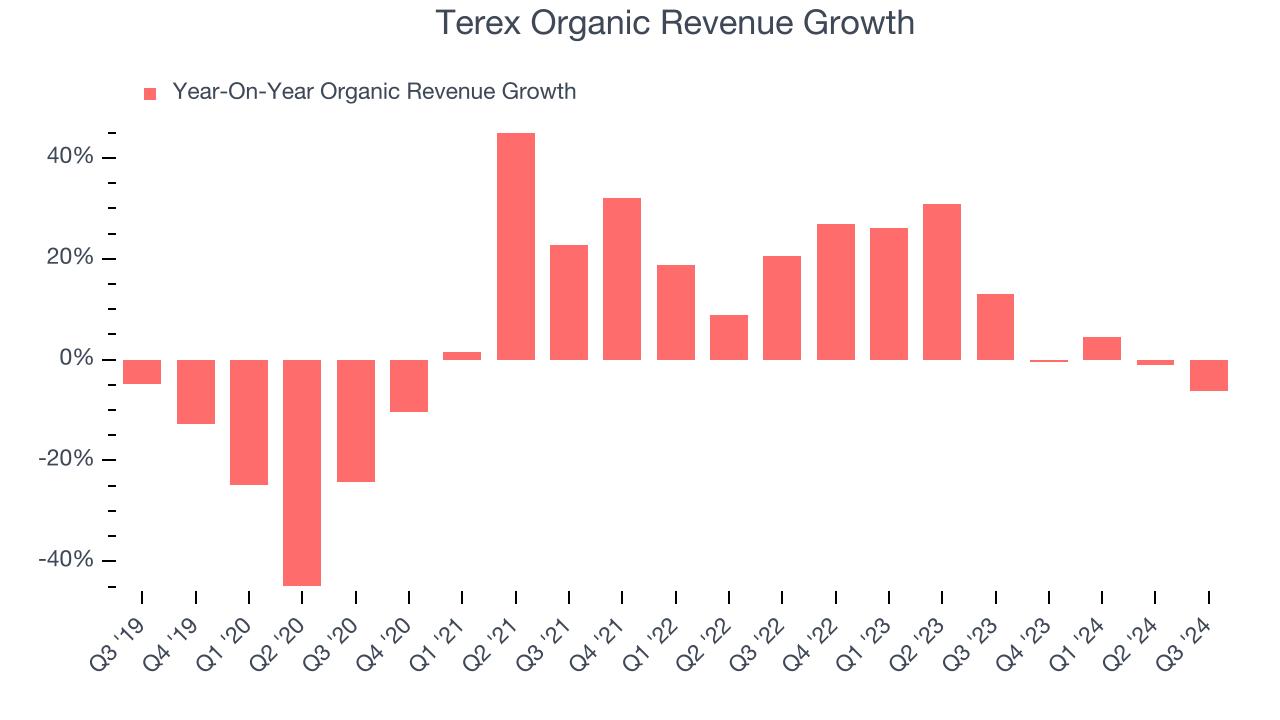
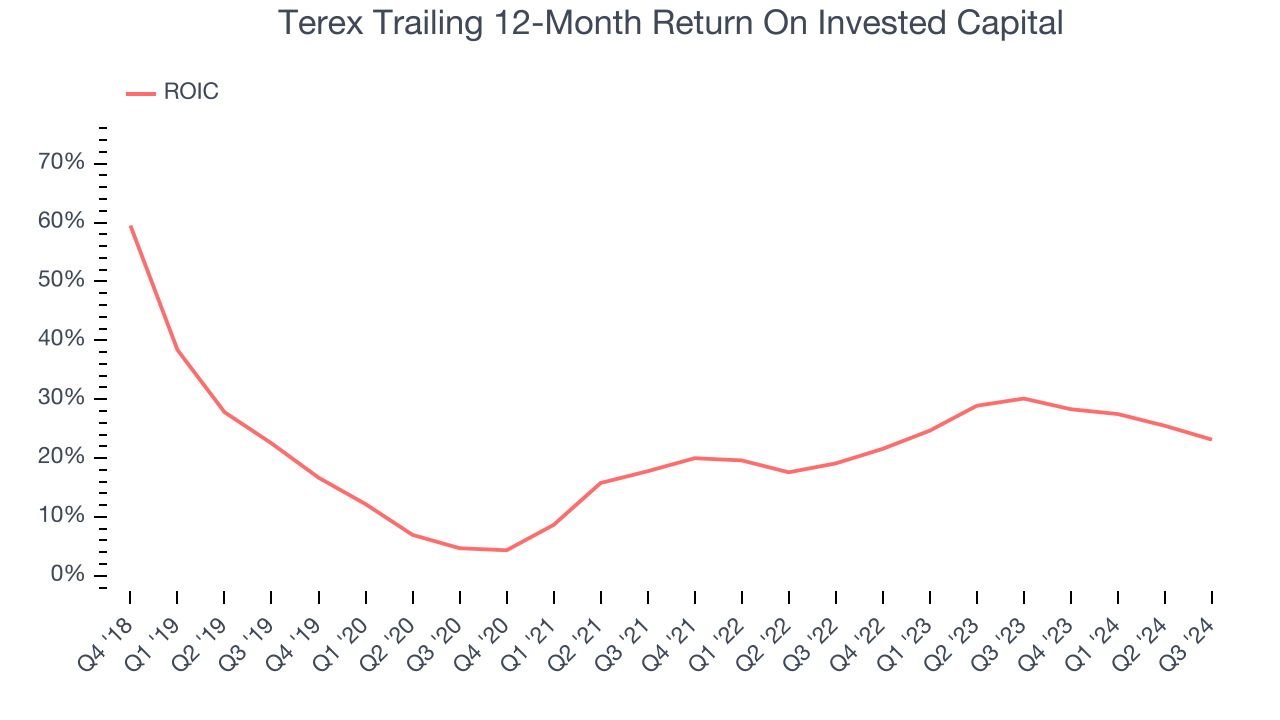
2. New Investments Bear Fruit as ROIC Jumps
A company’s ROIC, or return on invested capital, shows how much operating profit it makes compared to the money it has raised (debt and equity).
We typically prefer to invest in companies with high returns because it means they have viable business models, but the trend in a company’s ROIC is often what surprises the market and moves the stock price. Fortunately, Terex’s ROIC has increased significantly over the last few years. This is a great sign when paired with its already strong returns. It could suggest its competitive advantage or profitable growth opportunities are expanding.
One Reason to be Careful:
Long-Term Revenue Growth Disappoints
Examining a company’s long-term performance can provide clues about its quality. Any business can put up a good quarter or two, but the best consistently grow over the long haul. Unfortunately, Terex’s 2.5% annualized revenue growth over the last five years was sluggish. This fell short of our benchmarks. 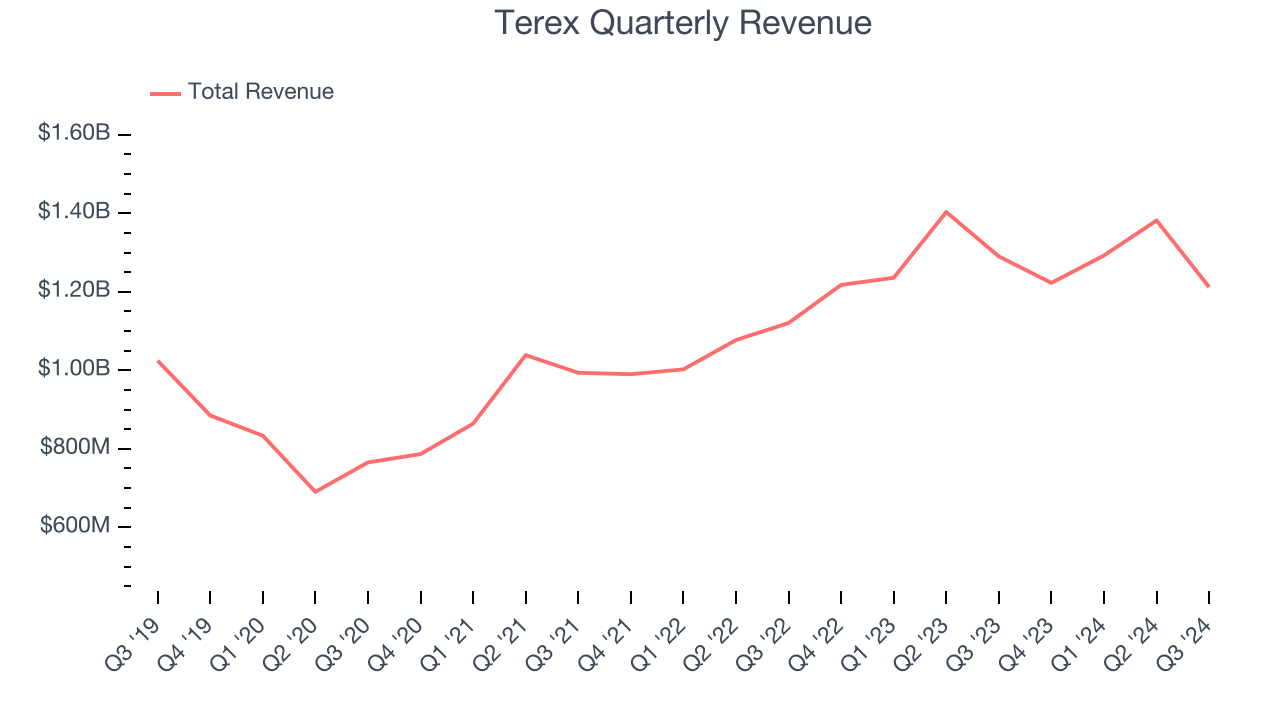
Final Judgment
Terex’s merits more than compensate for its flaws. With the recent decline, the stock trades at 9.3× forward price-to-earnings (or $49.55 per share). Is now the right time to buy? See for yourself in our in-depth research report, it’s free.
Stocks We Like Even More Than Terex
The Trump trade may have passed, but rates are still dropping and inflation is still cooling. Opportunities are ripe for those ready to act - and we’re here to help you pick them.
Get started by checking out our Top 5 Growth Stocks for this month. This is a curated list of our High Quality stocks that have generated a market-beating return of 175% over the last five years.
Stocks that made our list in 2019 include now familiar names such as Nvidia (+2,691% between September 2019 and September 2024) as well as under-the-radar businesses like United Rentals (+550% five-year return). Find your next big winner with StockStory today for free.