
Stanley Black & Decker currently trades at $81.91 per share and has shown little upside over the past six months, posting a small loss of 2.9%. The stock also fell short of the S&P 500’s 10.6% gain during that period.
Is now the time to buy Stanley Black & Decker, or should you be careful about including it in your portfolio? Get the full breakdown from our expert analysts, it’s free.We're sitting this one out for now. Here are three reasons why you should be careful with SWK and a stock we'd rather own.
Why Do We Think Stanley Black & Decker Will Underperform?
With an iconic “STANLEY” logo which has remained virtually unchanged for over a century, Stanley Black & Decker (NYSE: SWK) is a manufacturer primarily catering to the tool and outdoor equipment industry.
1. Core Business Falling Behind as Demand Declines
Investors interested in Professional Tools and Equipment companies should track organic revenue in addition to reported revenue. This metric gives visibility into Stanley Black & Decker’s core business because it excludes one-time events such as mergers, acquisitions, and divestitures along with foreign currency fluctuations - non-fundamental factors that can manipulate the income statement.
Over the last two years, Stanley Black & Decker’s organic revenue averaged 3.7% year-on-year declines. This performance was underwhelming and implies it may need to improve its products, pricing, or go-to-market strategy. It also suggests Stanley Black & Decker might have to lean into acquisitions to grow, which isn’t ideal because M&A can be expensive and risky (integrations often disrupt focus). 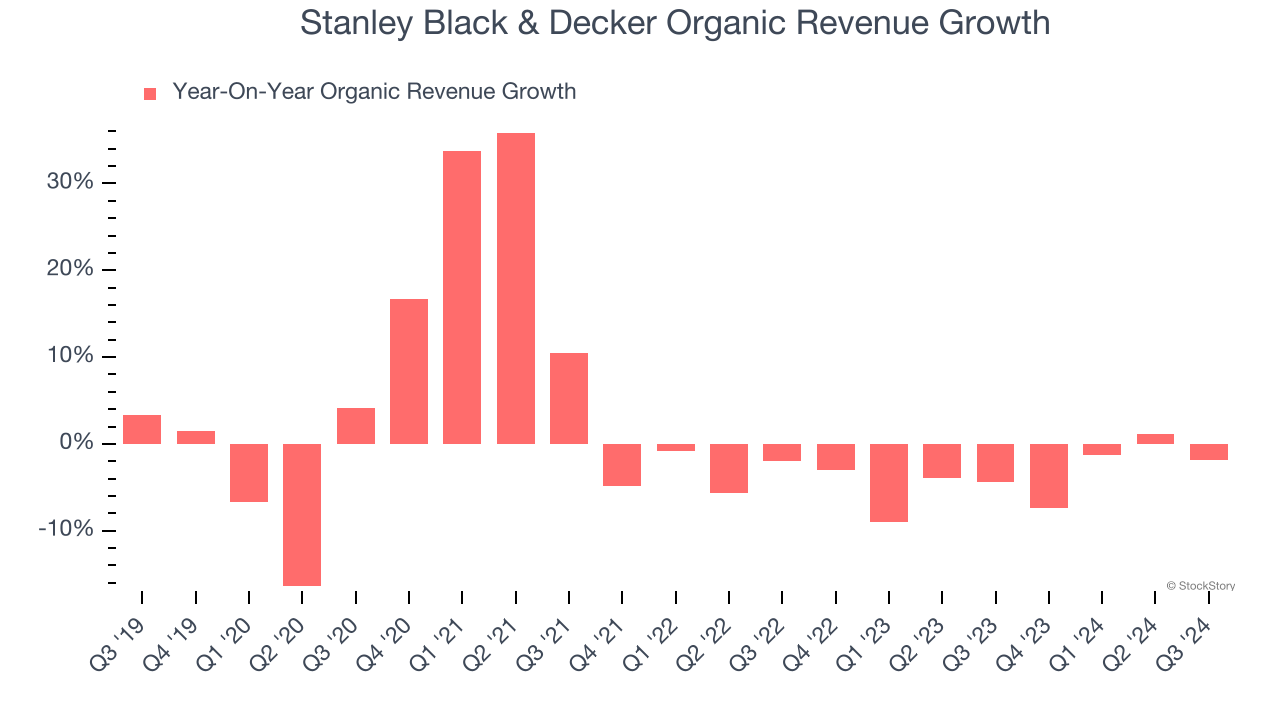
2. Free Cash Flow Margin Dropping
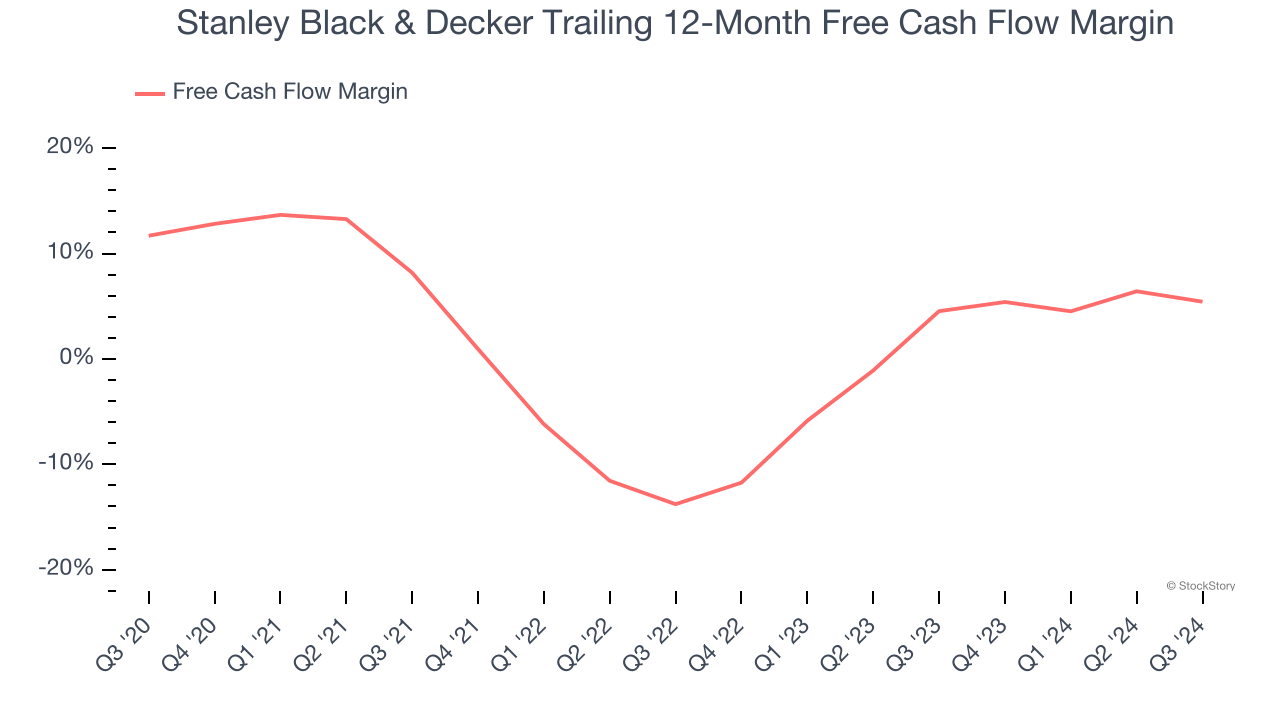
Free cash flow isn't a prominently featured metric in company financials and earnings releases, but we think it's telling because it accounts for all operating and capital expenses, making it tough to manipulate. Cash is king.
As you can see below, Stanley Black & Decker’s margin dropped by 6.3 percentage points over the last five years. Almost any movement in the wrong direction is undesirable because of its already low cash conversion. If the trend continues, it could signal it’s becoming a more capital-intensive business. Stanley Black & Decker’s free cash flow margin for the trailing 12 months was 5.4%.
3. New Investments Fail to Bear Fruit as ROIC Declines
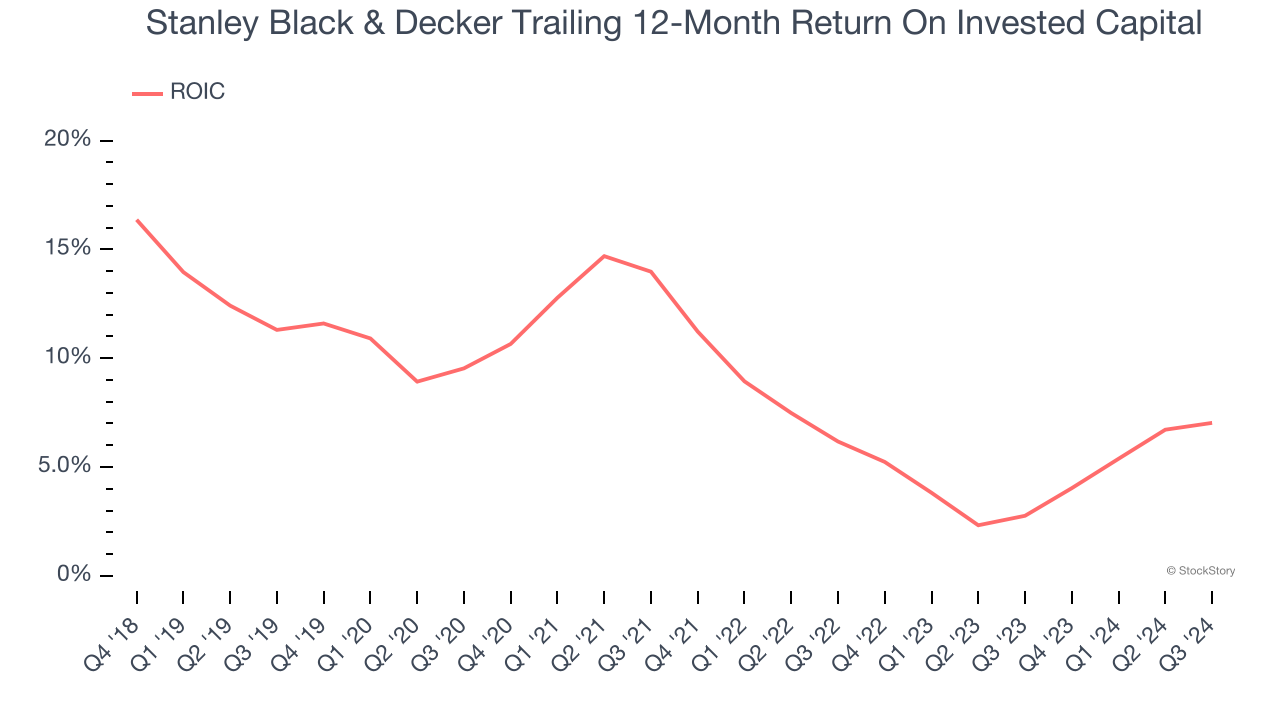
A company’s ROIC, or return on invested capital, shows how much operating profit it makes compared to the money it has raised (debt and equity).
We typically prefer to invest in companies with high returns because it means they have viable business models, but the trend in a company’s ROIC is often what surprises the market and moves the stock price. Stanley Black & Decker’s ROIC has decreased over the last few years. Paired with its already low returns, these declines suggest its profitable growth opportunities are few and far between.
Final Judgment
We cheer for all companies making their customers lives easier, but in the case of Stanley Black & Decker, we’ll be cheering from the sidelines. With its shares lagging the market recently, the stock trades at 14.3× forward price-to-earnings (or $81.91 per share). This valuation is reasonable, but the company’s shaky fundamentals present too much downside risk. There are superior stocks to buy right now. Let us point you toward CrowdStrike, the most entrenched endpoint security platform.
Stocks We Like More Than Stanley Black & Decker
The Trump trade may have passed, but rates are still dropping and inflation is still cooling. Opportunities are ripe for those ready to act - and we’re here to help you pick them.
Get started by checking out our Top 6 Stocks for this week. This is a curated list of our High Quality stocks that have generated a market-beating return of 175% over the last five years.
Stocks that made our list in 2019 include now familiar names such as Nvidia (+2,691% between September 2019 and September 2024) as well as under-the-radar businesses like United Rentals (+550% five-year return). Find your next big winner with StockStory today for free.


