
WD-40’s 15.9% return over the past six months has outpaced the S&P 500 by 8.2%, and its stock price has climbed to $259.09 per share. This run-up might have investors contemplating their next move.
Following the strength, is WDFC a buy right now? Or is the market overestimating its value? Find out in our full research report, it’s free.
Why Does WD-40 Spark Debate?
Short for “Water Displacement perfected on the 40th try”, WD-40 (NASDAQ: WDFC) is a renowned American consumer goods company known for its iconic and versatile spray, WD-40 Multi-Use Product.
Two Positive Attributes:
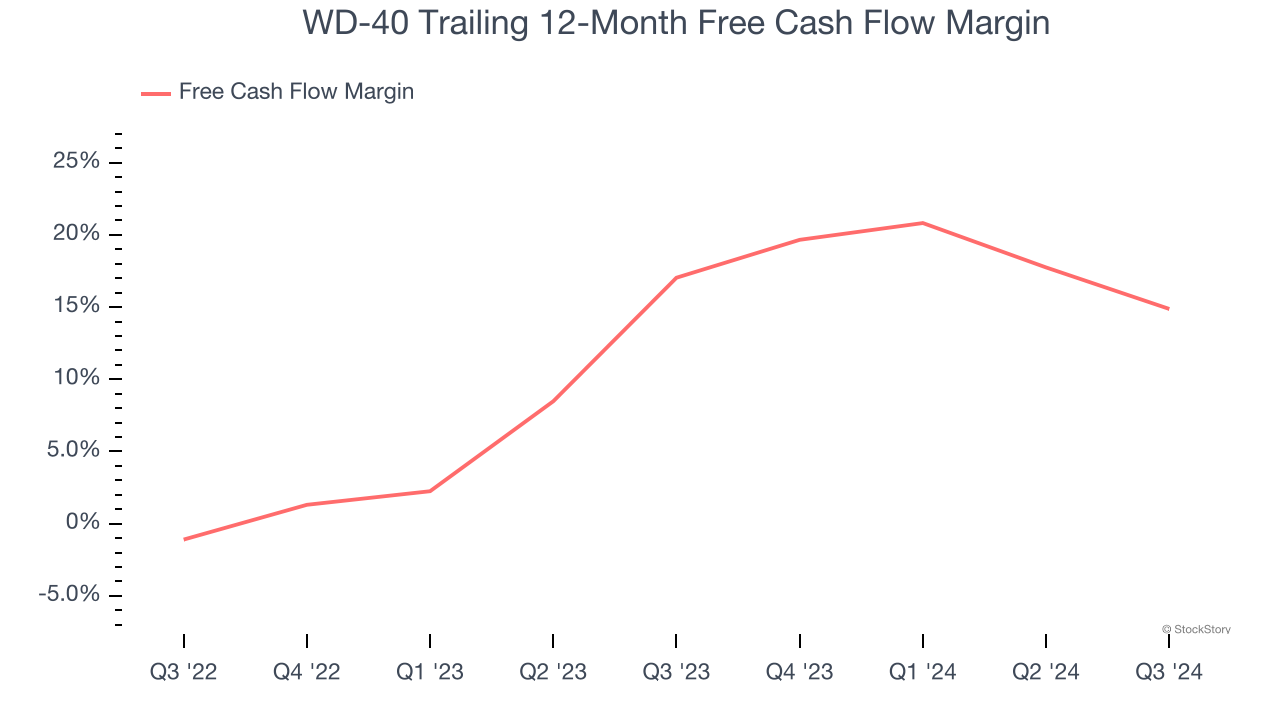
1. Excellent Free Cash Flow Margin Boosts Reinvestment Potential
If you’ve followed StockStory for a while, you know we emphasize free cash flow. Why, you ask? We believe that in the end, cash is king, and you can’t use accounting profits to pay the bills.
WD-40 has shown terrific cash profitability, driven by its lucrative business model that enables it to reinvest, return capital to investors, and stay ahead of the competition. The company’s free cash flow margin was among the best in the consumer staples sector, averaging 15.9% over the last two years.
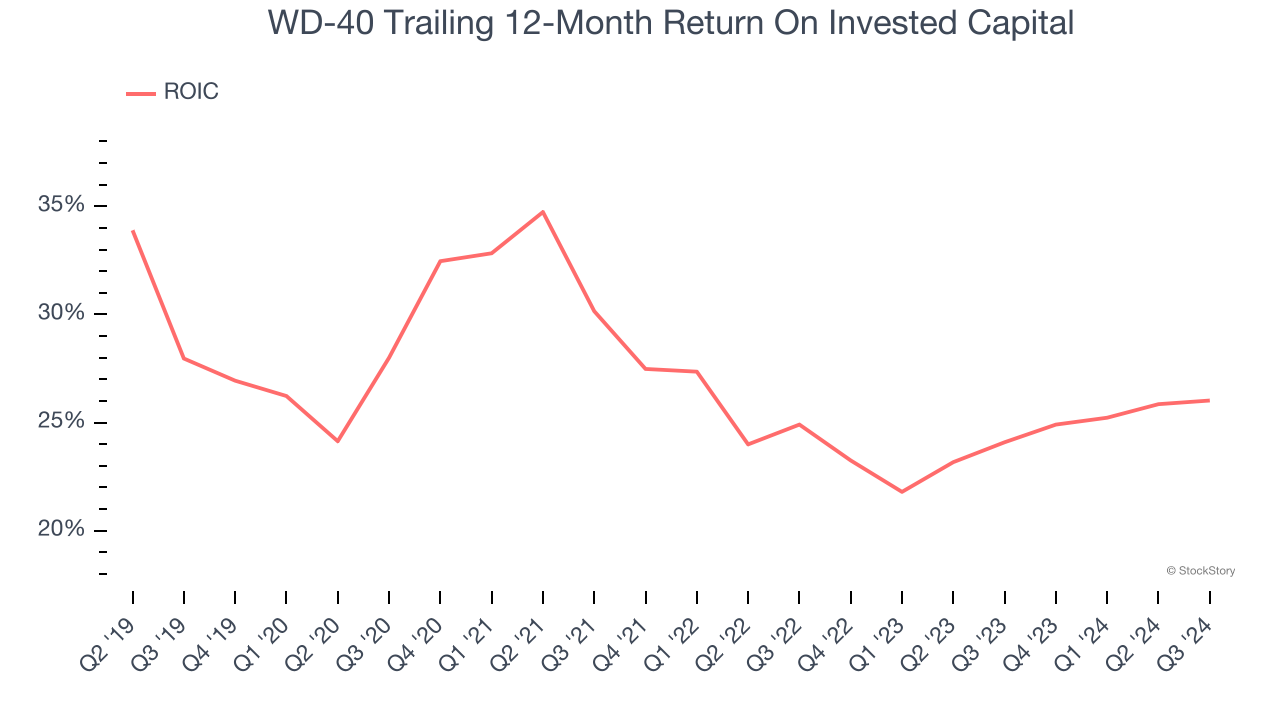
2. Stellar ROIC Showcases Lucrative Growth Opportunities
Growth gives us insight into a company’s long-term potential, but how capital-efficient was that growth? Enter ROIC, a metric showing how much operating profit a company generates relative to the money it has raised (debt and equity).
WD-40’s five-year average ROIC was 26.6%, placing it among the best consumer staples companies. This illustrates its management team’s ability to invest in highly profitable ventures and produce tangible results for shareholders.
One Reason to be Careful:
Long-Term Revenue Growth Disappoints
A company’s long-term sales performance can indicate its overall quality. Any business can put up a good quarter or two, but many enduring ones grow for years. Regrettably, WD-40’s sales grew at a mediocre 6.6% compounded annual growth rate over the last three years. This was below our standard for the consumer staples sector. 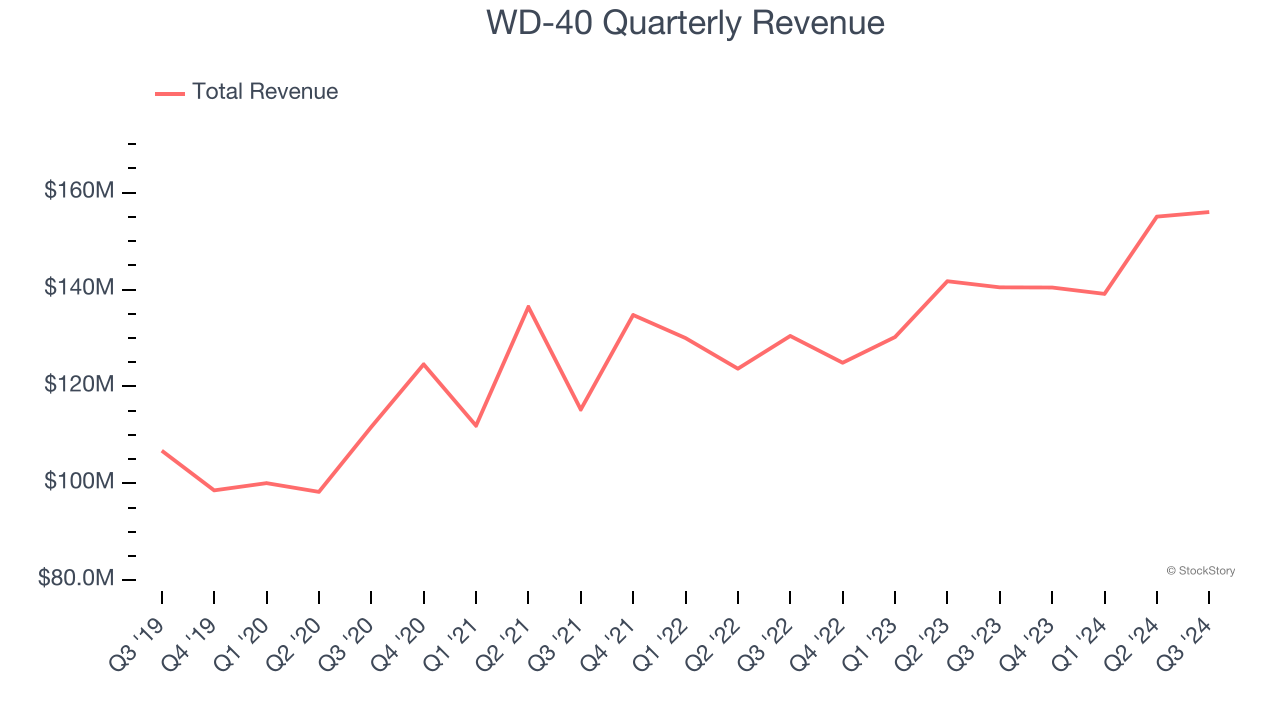
Final Judgment
WD-40’s merits more than compensate for its flaws, and with its shares topping the market in recent months, the stock trades at 46.1× forward price-to-earnings (or $259.09 per share). Is now the time to initiate a position? See for yourself in our in-depth research report, it’s free.
Stocks We Like Even More Than WD-40
The elections are now behind us. With rates dropping and inflation cooling, many analysts expect a breakout market to cap off the year - and we’re zeroing in on the stocks that could benefit immensely.
Take advantage of the rebound by checking out our Top 9 Market-Beating Stocks. This is a curated list of our High Quality stocks that have generated a market-beating return of 175% over the last five years.
Stocks that made our list in 2019 include now familiar names such as Nvidia (+2,691% between September 2019 and September 2024) as well as under-the-radar businesses like Comfort Systems (+783% five-year return). Find your next big winner with StockStory today for free.


