
Over the past six months, Amkor’s shares (currently trading at $26.45) have posted a disappointing 18.2% loss, well below the S&P 500’s 14% gain. This was partly driven by its softer quarterly results and might have investors contemplating their next move.
Is now the time to buy Amkor, or should you be careful about including it in your portfolio? Get the full stock story straight from our expert analysts, it’s free.Despite the more favorable entry price, we're swiping left on Amkor for now. Here are three reasons why AMKR doesn't excite us and a stock we'd rather own.
Why Is Amkor Not Exciting?
Operating through a largely Asian facility footprint, Amkor Technologies (NASDAQ: AMKR) provides outsourced packaging and testing for semiconductors.
1. Revenue Tumbling Downwards
We at StockStory place the most emphasis on long-term growth, but within semiconductors, a stretched historical view may miss new demand cycles or industry trends like AI. Amkor’s recent history marks a sharp pivot from its five-year trend as its revenue has shown annualized declines of 3.5% over the last two years. 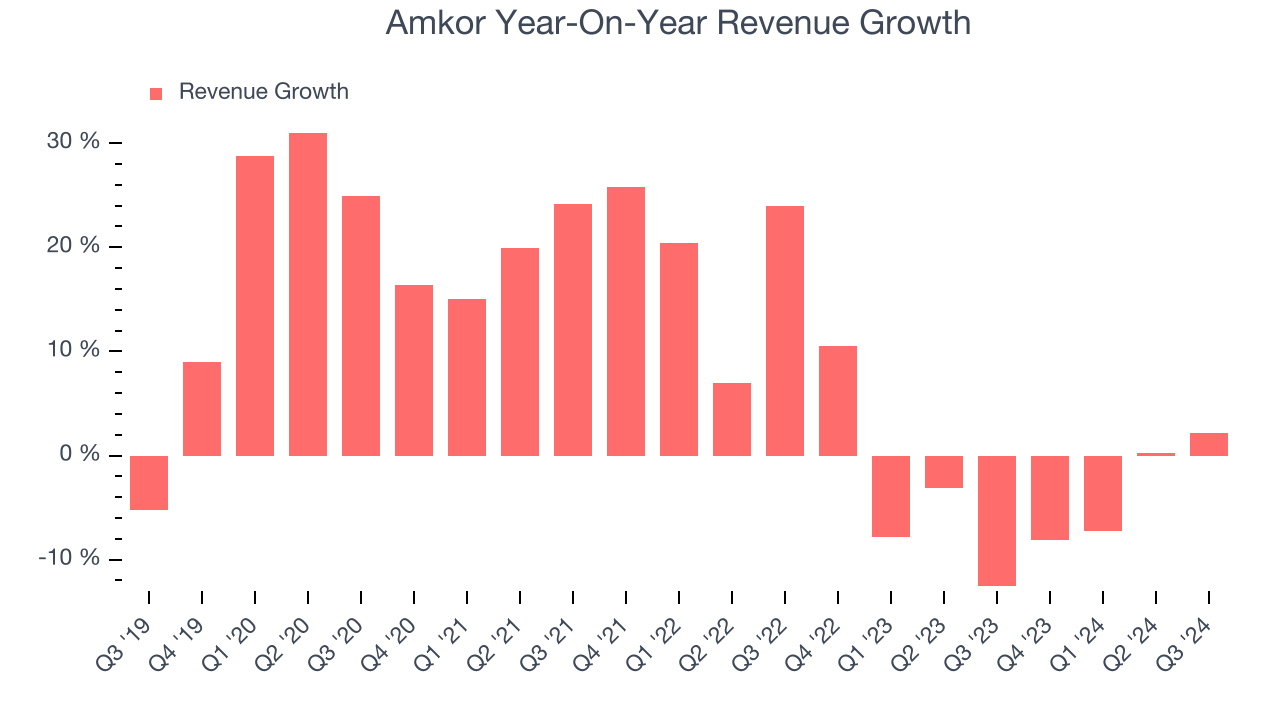
2. Low Gross Margin Reveals Weak Structural Profitability
In the semiconductor industry, a company’s gross profit margin is a critical metric to track because it sheds light on its pricing power, complexity of products, and ability to procure raw materials, equipment, and labor.
Amkor’s gross margin is one of the worst in the semiconductor industry, signaling it operates in a competitive market and lacks pricing power. As you can see below, it averaged a 15% gross margin over the last two years. Said differently, Amkor had to pay a chunky $85.01 to its suppliers for every $100 in revenue. 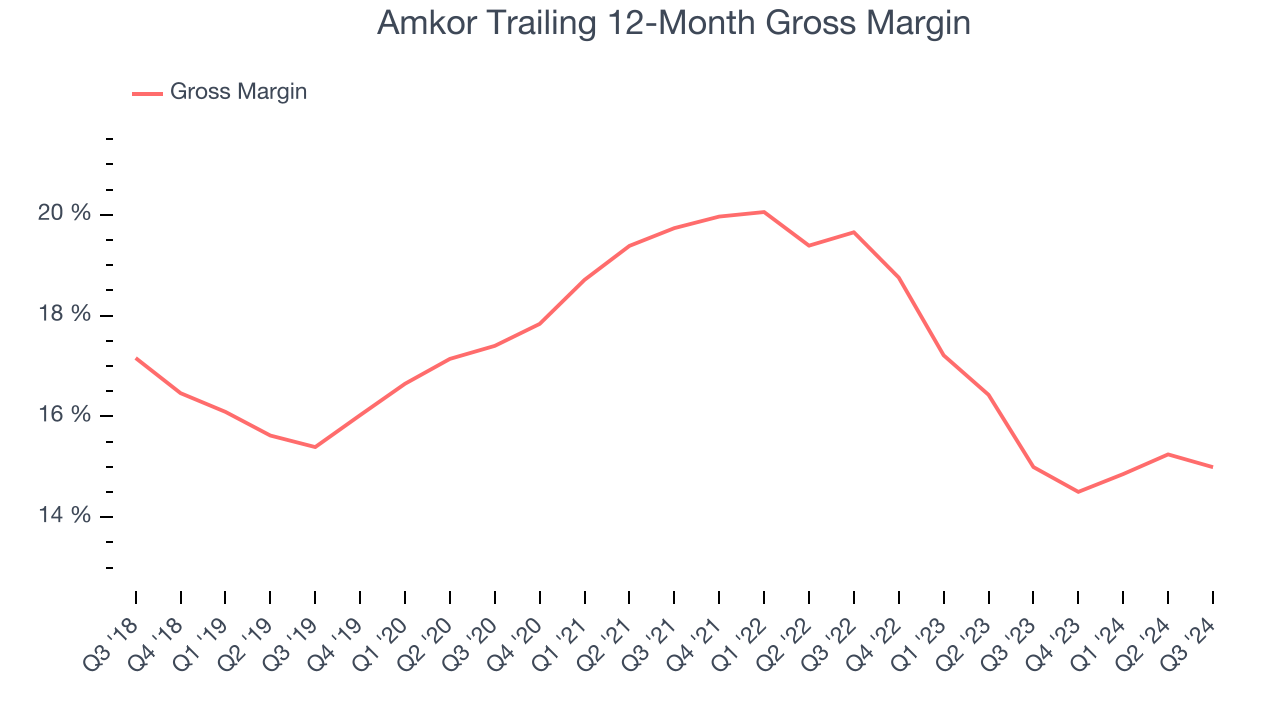
3. Weak Operating Margin Could Cause Trouble
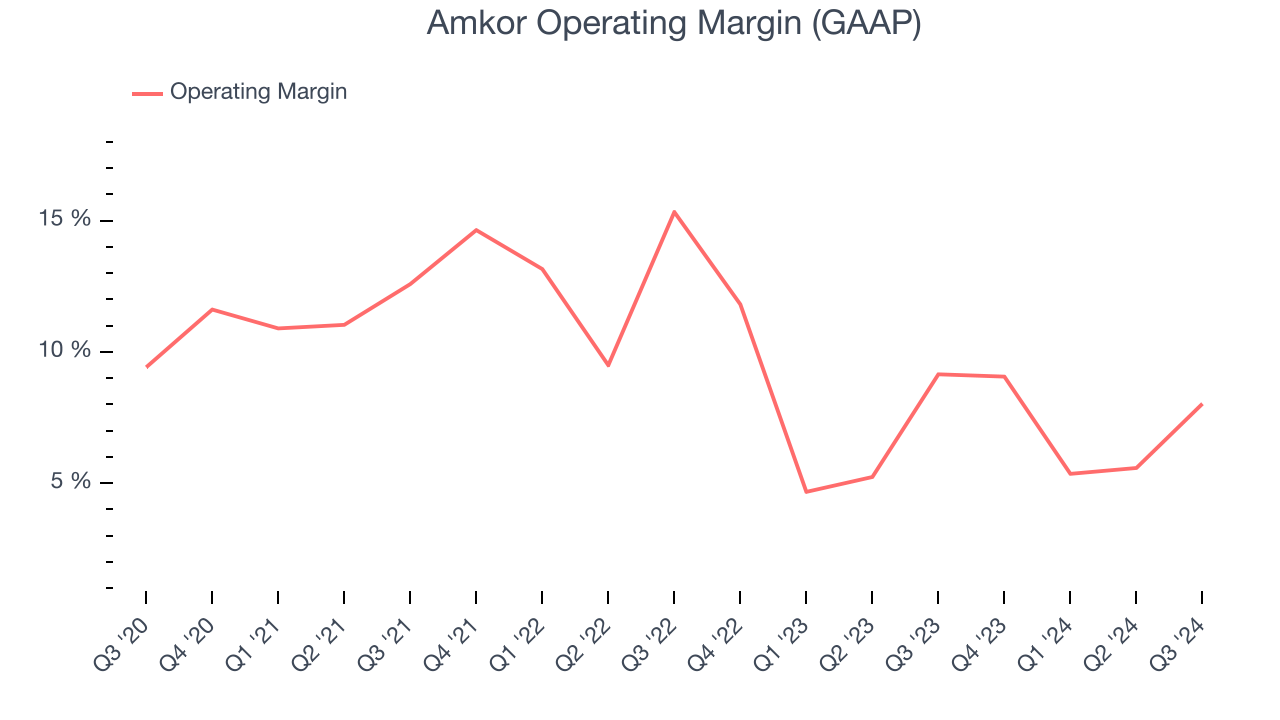
Operating margin is one of the best measures of profitability because it tells us how much money a company takes home after procuring and manufacturing its products, marketing and selling those products, and most importantly, keeping them relevant through research and development.
Amkor was profitable over the last two years but held back by its large cost base. Its average operating margin of 7.6% was weak for a semiconductor business. This result isn’t too surprising given its low gross margin as a starting point.
Final Judgment
Amkor isn’t a terrible business, but it doesn’t pass our quality test. Following the recent decline, the stock trades at 12x forward price-to-earnings (or $26.45 per share). While this valuation is fair, the upside isn’t great compared to the potential downside. We're pretty confident there are more exciting stocks to buy at the moment. We’d recommend looking at KLA Corporation, a picks and shovels play for semiconductor manufacturing.
Stocks We Like More Than Amkor
The elections are now behind us. With rates dropping and inflation cooling, many analysts expect a breakout market to cap off the year - and we’re zeroing in on the stocks that could benefit immensely.
Take advantage of the rebound by checking out our Top 9 Market-Beating Stocks. This is a curated list of our High Quality stocks that have generated a market-beating return of 175% over the last five years.
Stocks that made our list in 2019 include now familiar names such as Nvidia (+2,691% between September 2019 and September 2024) as well as under-the-radar businesses like United Rentals (+550% five-year return). Find your next big winner with StockStory today for free.