Guidewire’s 26.4% return over the past six months has outpaced the S&P 500 by 20.2%, and its stock price has climbed to $171.36 per share. This was partly due to its solid quarterly results, and the performance may have investors wondering how to approach the situation.
Is now the time to buy Guidewire, or should you be careful about including it in your portfolio? Get the full breakdown from our expert analysts, it’s free.We’re happy investors have made money, but we don't have much confidence in Guidewire. Here are three reasons why GWRE doesn't excite us and a stock we'd rather own.
Why Is Guidewire Not Exciting?
Founded by two individuals involved in the development of leading procurement software Ariba, Guidewire (NYSE: GWRE) offers insurance companies a software-as-a-service platform to help sell their products and manage their workflows.
1. Long-Term Revenue Growth Disappoints
A company’s long-term sales performance can indicate its overall quality. Any business can put up a good quarter or two, but many enduring ones grow for years. Over the last three years, Guidewire grew its sales at a 11.9% compounded annual growth rate. Although this growth is solid on an absolute basis, it fell short of our benchmark for the software sector. 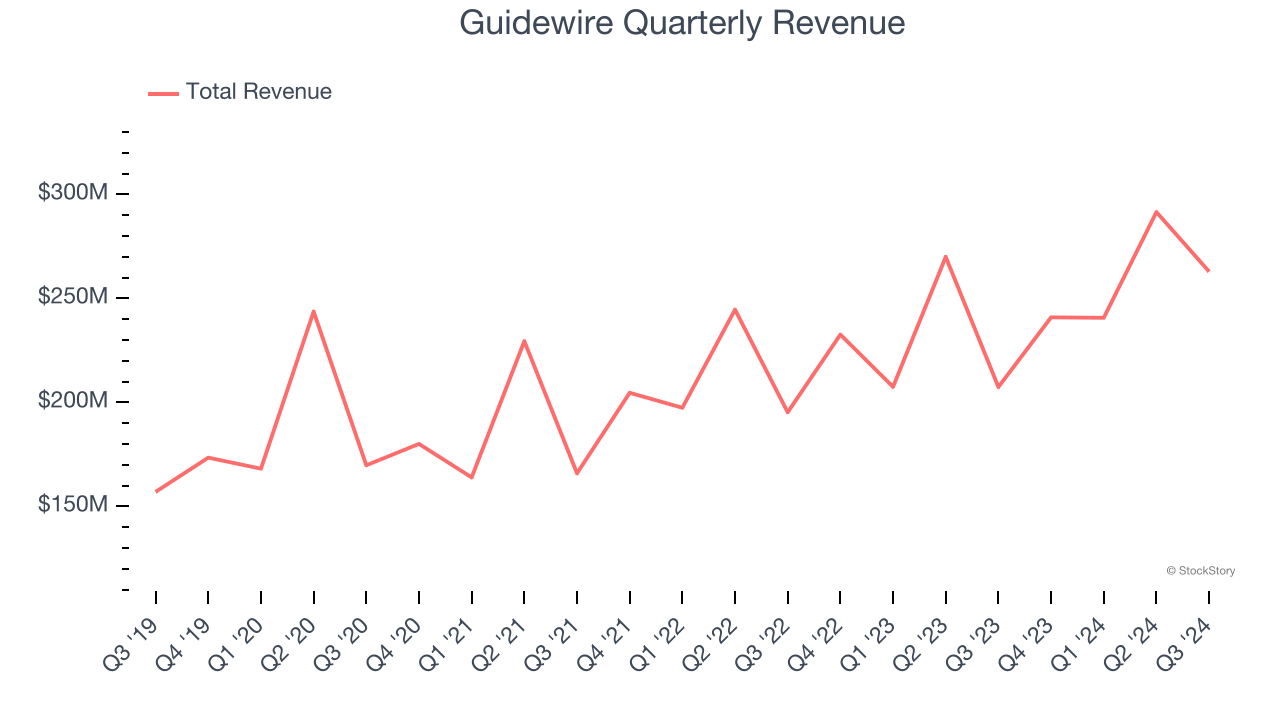
2. Low Gross Margin Reveals Weak Structural Profitability
For software companies like Guidewire, gross profit tells us how much money remains after paying for the base cost of products and services (typically servers, licenses, and certain personnel). These costs are usually low as a percentage of revenue, explaining why software is more lucrative than other sectors.
Guidewire’s gross margin is substantially worse than most software businesses, signaling it has relatively high infrastructure costs compared to asset-lite businesses like ServiceNow. As you can see below, it averaged a 61.1% gross margin over the last year. Said differently, Guidewire had to pay a chunky $38.92 to its service providers for every $100 in revenue. 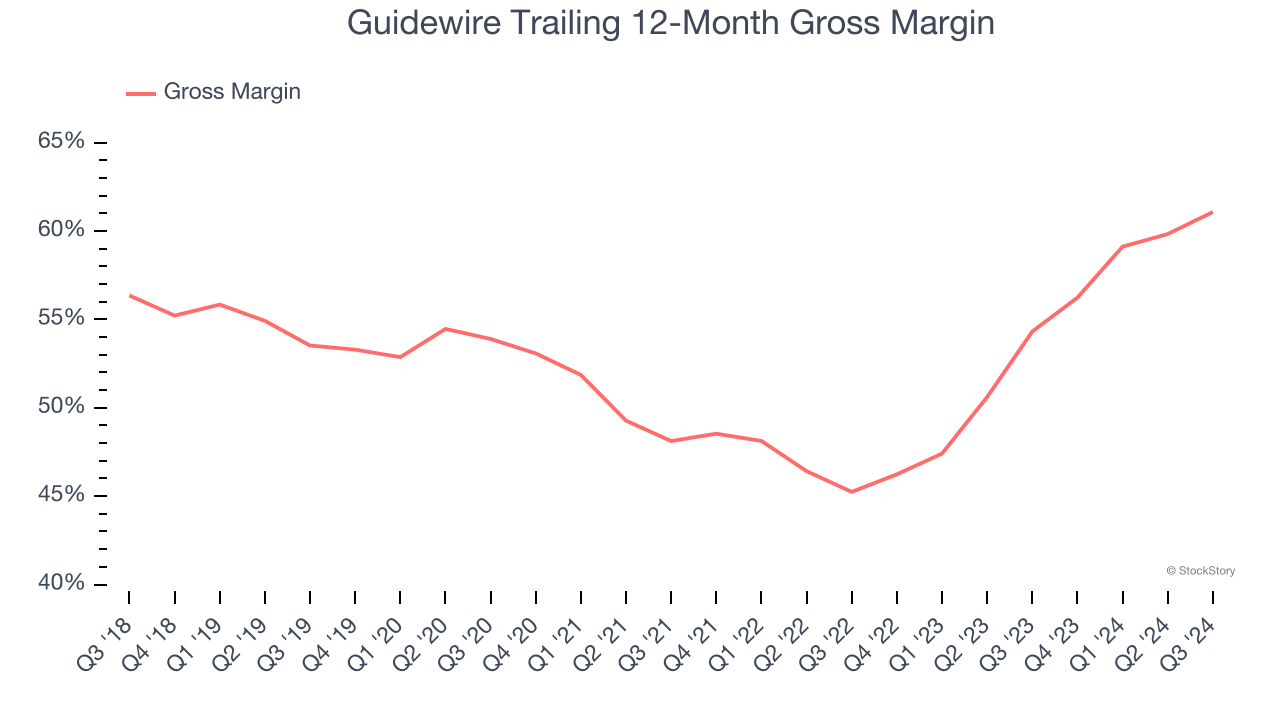
3. Long Payback Periods Delay Returns
The customer acquisition cost (CAC) payback period represents the months required to recover the cost of acquiring a new customer. Essentially, it’s the break-even point for sales and marketing investments. A shorter CAC payback period is ideal, as it implies better returns on investment and business scalability.
Guidewire’s recent customer acquisition efforts haven’t yielded returns as its CAC payback period was negative this quarter, meaning its sales and marketing investments outpaced its revenue. The company’s inefficiency indicates it operates in a competitive market and must continue investing to grow.
Final Judgment
Guidewire’s business quality ultimately falls short of our standards. With its shares topping the market in recent months, the stock trades at 12.5× forward price-to-sales (or $171.36 per share). This valuation tells us it’s a bit of a market darling with a lot of good news priced in - we think there are better investment opportunities out there. We’d suggest looking at Yum! Brands, an all-weather company that owns household favorite Taco Bell.
Stocks We Would Buy Instead of Guidewire
With rates dropping, inflation stabilizing, and the elections in the rearview mirror, all signs point to the start of a new bull run - and we’re laser-focused on finding the best stocks for this upcoming cycle.
Put yourself in the driver’s seat by checking out our Top 6 Stocks for this week. This is a curated list of our High Quality stocks that have generated a market-beating return of 175% over the last five years.
Stocks that made our list in 2019 include now familiar names such as Nvidia (+2,691% between September 2019 and September 2024) as well as under-the-radar businesses like Comfort Systems (+783% five-year return). Find your next big winner with StockStory today for free.