
What a time it’s been for Everi. In the past six months alone, the company’s stock price has increased by a massive 68.1%, reaching $13.50 per share. This performance may have investors wondering how to approach the situation.
Is it too late to buy EVRI? Find out in our full research report, it’s free.
Why Does Everi Spark Debate?
Formed between the 2015 merger of Global Cash Access and Multimedia Games, Everi (NYSE: EVRI) is a producer of games and financial infrastructure for the casino and hospitality industries.
Two Positive Attributes:
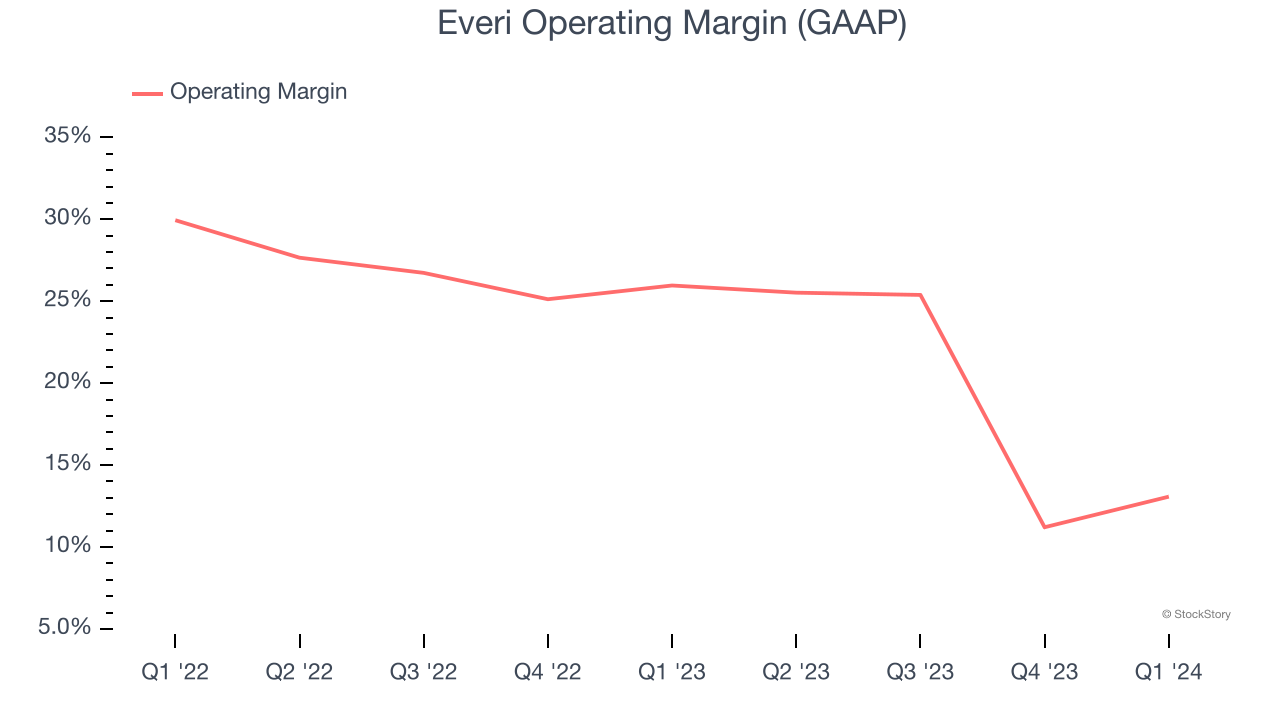
1. Operating Margin Reveals a Well-Run Organization
Operating margin is a key measure of profitability. Think of it as net income - the bottom line - excluding the impact of taxes and interest on debt, which are less connected to business fundamentals.
Everi’s operating margin has shrunk over the last 12 months, but it still averaged 22.7% over the last two years, elite for a consumer discretionary business. This shows it’s an optimally-run company with an efficient cost structure, and we wouldn’t weigh the short-term trend too heavily.
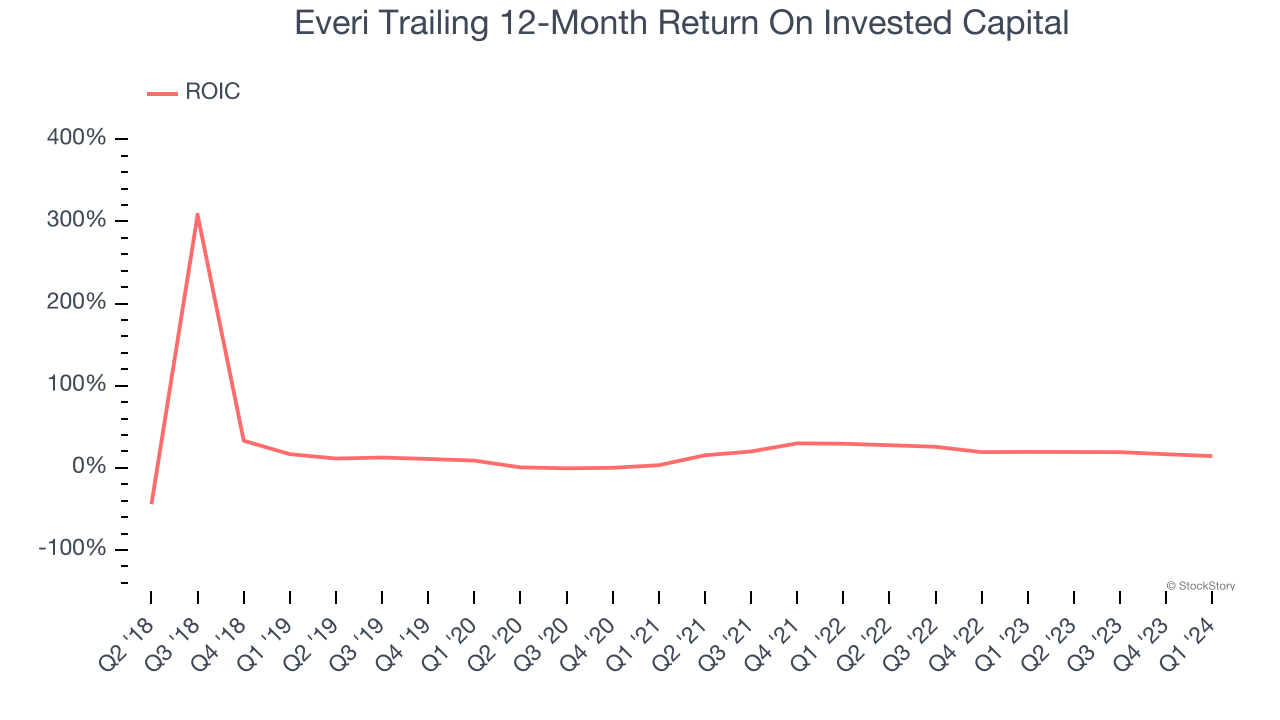
2. New Investments Bear Fruit as ROIC Jumps
A company’s ROIC, or return on invested capital, shows how much operating profit it makes compared to the money it has raised (debt and equity).
We typically prefer to invest in companies with high returns because it means they have viable business models, but the trend in a company’s ROIC is often what surprises the market and moves the stock price. Everi’s ROIC has increased significantly over the last few years. This is a great sign when paired with its already strong returns. It could suggest its competitive advantage or profitable growth opportunities are expanding.
One Reason to be Careful:
Long-Term Revenue Growth Disappoints
Reviewing a company’s long-term sales performance reveals insights into its quality. Any business can have short-term success, but a top-tier one grows for years. Over the last five years, Everi grew its sales at a 10.6% compounded annual growth rate. Although this growth is solid on an absolute basis, it fell short of our benchmark for the consumer discretionary sector. Luckily, there are other things to like about Everi. 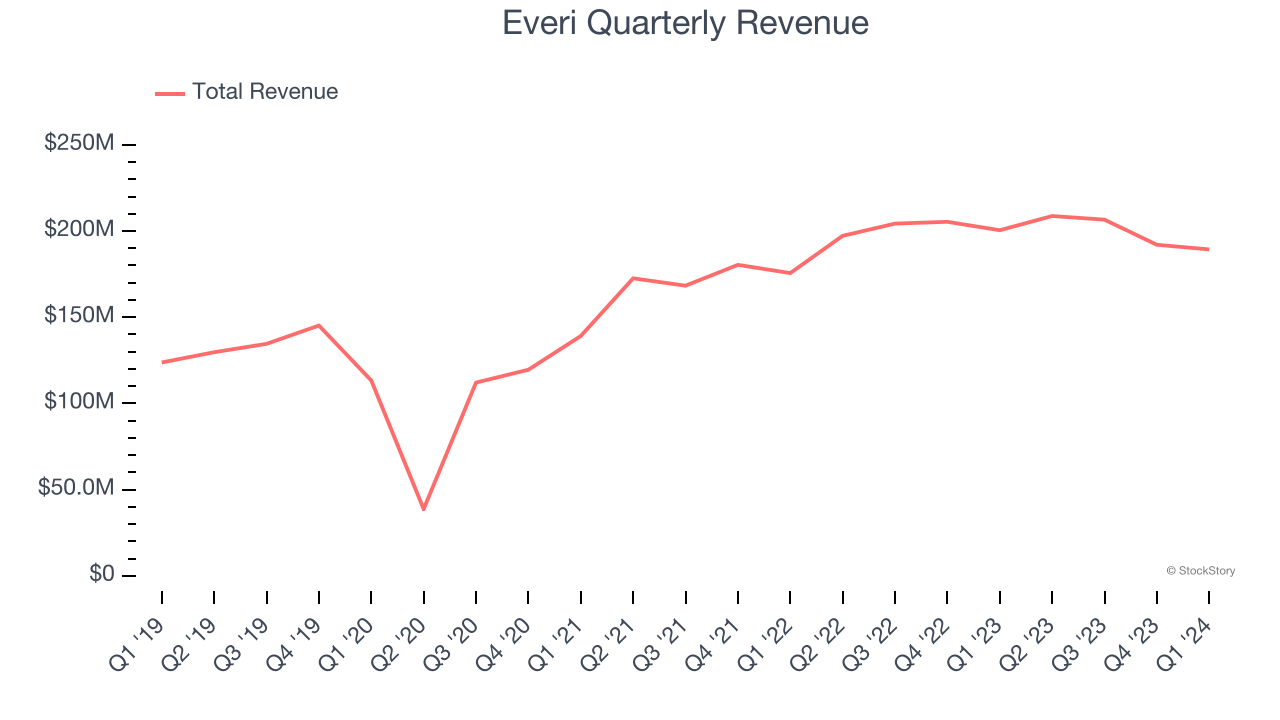
Final Judgment
Everi’s positive characteristics outweigh the negatives, and with the recent surge, the stock trades at 13.9× forward price-to-earnings (or $13.50 per share). Is now the right time to buy? See for yourself in our comprehensive research report, it’s free.
Stocks We Like Even More Than Everi
The elections are now behind us. With rates dropping and inflation cooling, many analysts expect a breakout market to cap off the year - and we’re zeroing in on the stocks that could benefit immensely.
Take advantage of the rebound by checking out our Top 6 Stocks for this week. This is a curated list of our High Quality stocks that have generated a market-beating return of 175% over the last five years.
Stocks that made our list in 2019 include now familiar names such as Nvidia (+2,691% between September 2019 and September 2024) as well as under-the-radar businesses like Comfort Systems (+783% five-year return). Find your next big winner with StockStory today for free.


