Varonis has been treading water for the past six months, recording a small return of 3.6% while holding steady at $44.91. This is close to the S&P 500’s 6% gain during that period.
Is there a buying opportunity in Varonis, or does it present a risk to your portfolio? Dive into our full research report to see our analyst team’s opinion, it’s free.We don't have much confidence in Varonis. Here are three reasons why we avoid VRNS and a stock we'd rather own.
Why Is Varonis Not Exciting?
Founded by a duo of former Israeli Defense Forces cyber warfare engineers, Varonis (NASDAQ: VRNS) offers software-as-service that helps customers protect data from cyber threats and gain visibility into how enterprise data is being used.
1. Long-Term Revenue Growth Disappoints
A company’s long-term performance is an indicator of its overall quality. While any business can experience short-term success, top-performing ones enjoy sustained growth for years. Over the last three years, Varonis grew its sales at a 15.1% annual rate. Although this growth is solid on an absolute basis, it fell slightly short of our benchmark for the software sector. 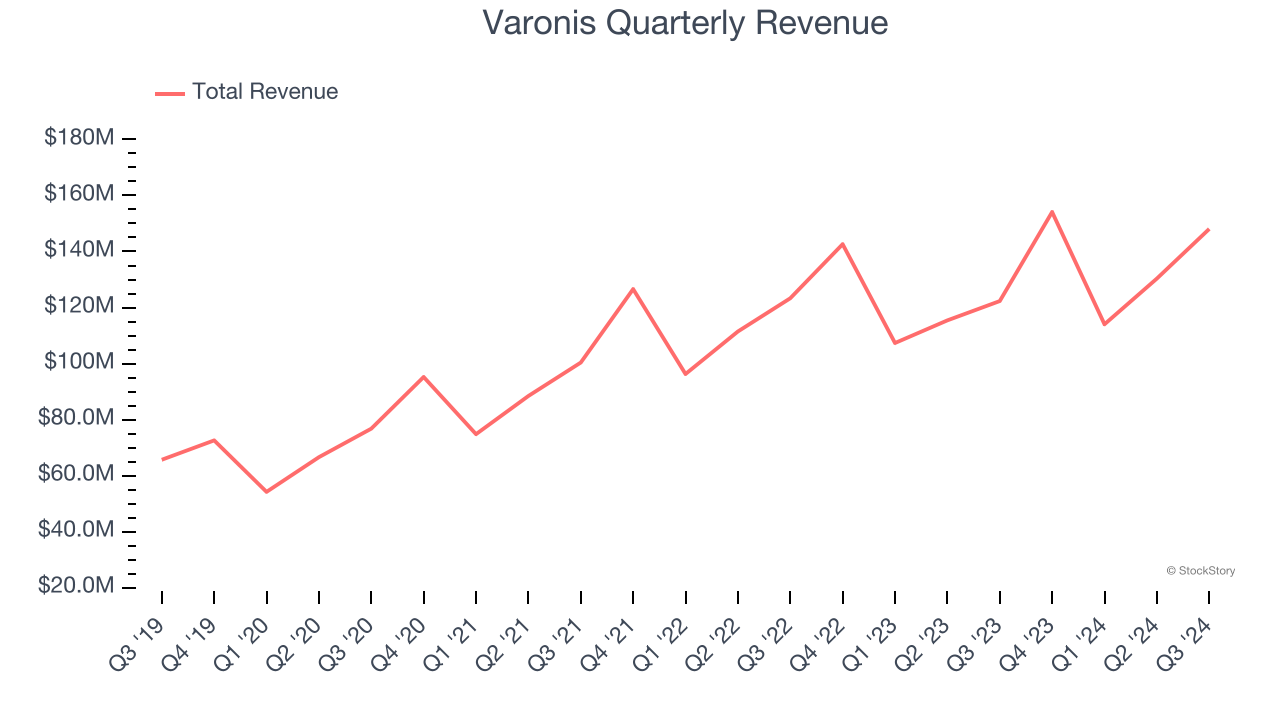
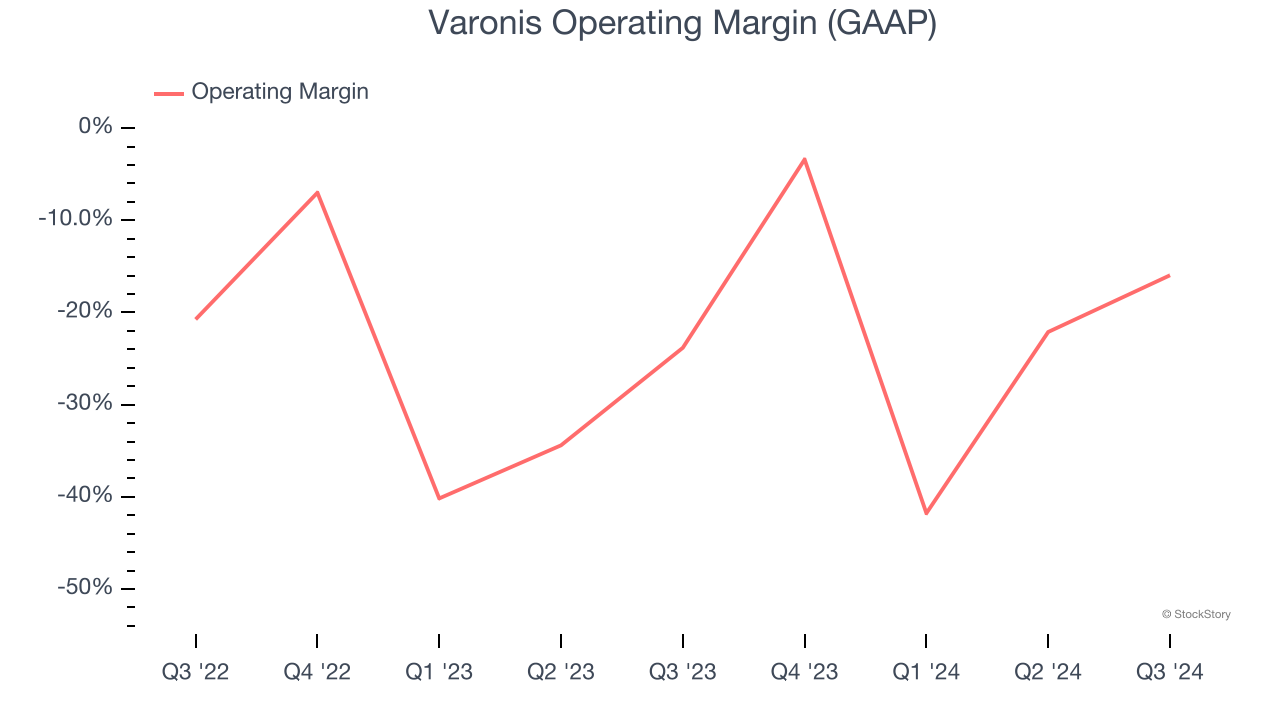
2. Operating Losses Sound the Alarms
While many software businesses point investors to their adjusted profits, which exclude stock-based compensation (SBC), we prefer GAAP operating margin because SBC is a legitimate expense used to attract and retain talent. This is one of the best measures of profitability because it shows how much money a company takes home after developing, marketing, and selling its products.
Varonis’s expensive cost structure has contributed to an average operating margin of negative 19.3% over the last year. Unprofitable software companies require extra attention because they spend heaps of money to capture market share. As seen in its historically underwhelming revenue performance, this strategy hasn’t worked so far, and it’s unclear what would happen if Varonis reeled back its investments. Wall Street seems to think it will face some obstacles, and we tend to agree.
3. Cash Flow Margin Set to Decline
If you’ve followed StockStory for a while, you know we emphasize free cash flow. Why, you ask? We believe that in the end, cash is king, and you can’t use accounting profits to pay the bills.
Over the next year, analysts predict Varonis’s cash conversion will fall. Their consensus estimates imply its free cash flow margin of 17.7% for the last 12 months will decrease to 14.7%.
Final Judgment
Varonis isn’t a terrible business, but it doesn’t pass our bar. That said, the stock currently trades at 8.4× forward price-to-sales (or $44.91 per share). Investors with a higher risk tolerance might like the company, but we think the potential downside is too great. We're pretty confident there are superior stocks to buy right now. We’d suggest looking at Costco, one of Charlie Munger’s all-time favorite businesses.
Stocks We Would Buy Instead of Varonis
The Trump trade may have passed, but rates are still dropping and inflation is still cooling. Opportunities are ripe for those ready to act - and we’re here to help you pick them.
Get started by checking out our Top 9 Market-Beating Stocks. This is a curated list of our High Quality stocks that have generated a market-beating return of 175% over the last five years.
Stocks that made our list in 2019 include now familiar names such as Nvidia (+2,691% between September 2019 and September 2024) as well as under-the-radar businesses like Comfort Systems (+783% five-year return). Find your next big winner with StockStory today for free.