C.H. Robinson Worldwide has had an impressive run over the past six months as its shares have beaten the S&P 500 by 7.7%. The stock now trades at $103.51, marking a 17% gain. This was partly thanks to its solid quarterly results, and the performance may have investors wondering how to approach the situation.
Is now the time to buy C.H. Robinson Worldwide, or should you be careful about including it in your portfolio? See what our analysts have to say in our full research report, it’s free.We’re glad investors have benefited from the price increase, but we're swiping left on C.H. Robinson Worldwide for now. Here are three reasons why CHRW doesn't excite us and a stock we'd rather own.
Why Do We Think C.H. Robinson Worldwide Will Underperform?
Engaging in contracts with tens of thousands of transportation companies, C.H. Robinson (NASDAQ: CHRW) offers freight transportation and logistics services.
1. Long-Term Revenue Growth Disappoints
A company’s long-term performance is an indicator of its overall quality. While any business can experience short-term success, top-performing ones enjoy sustained growth for years. Over the last five years, C.H. Robinson Worldwide grew its sales at a sluggish 2.6% compounded annual growth rate. This was below our standards. 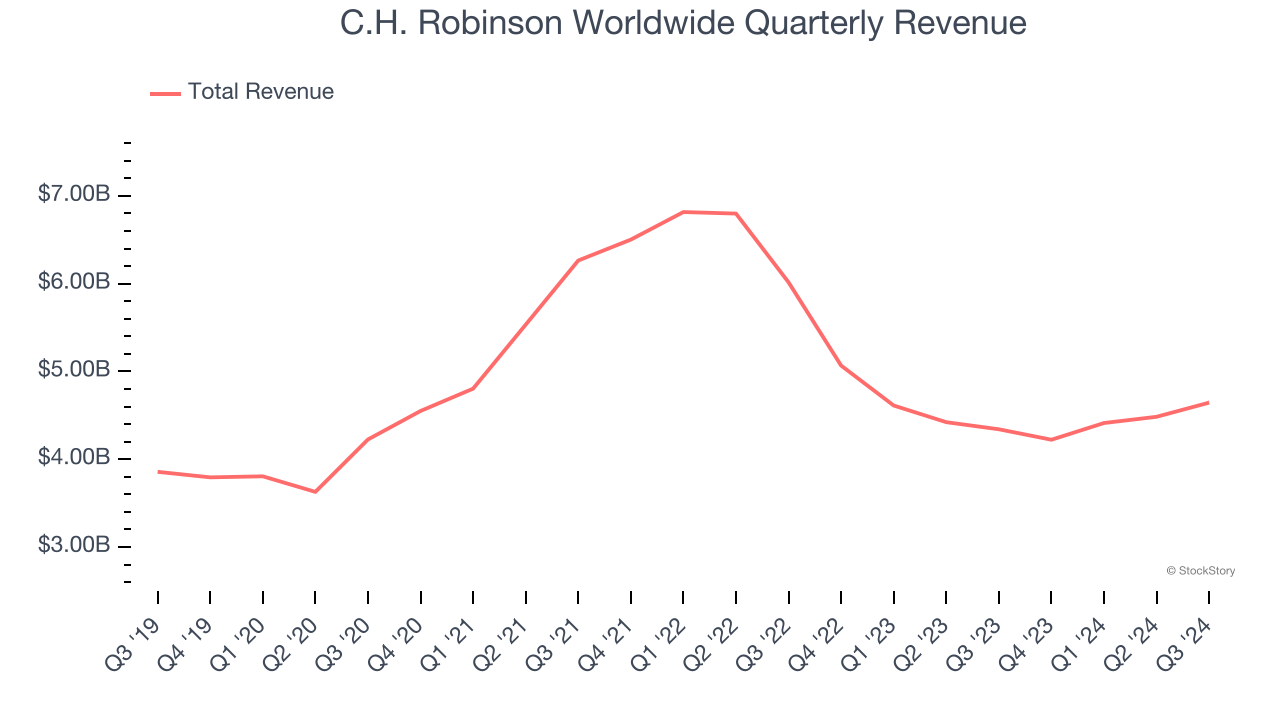
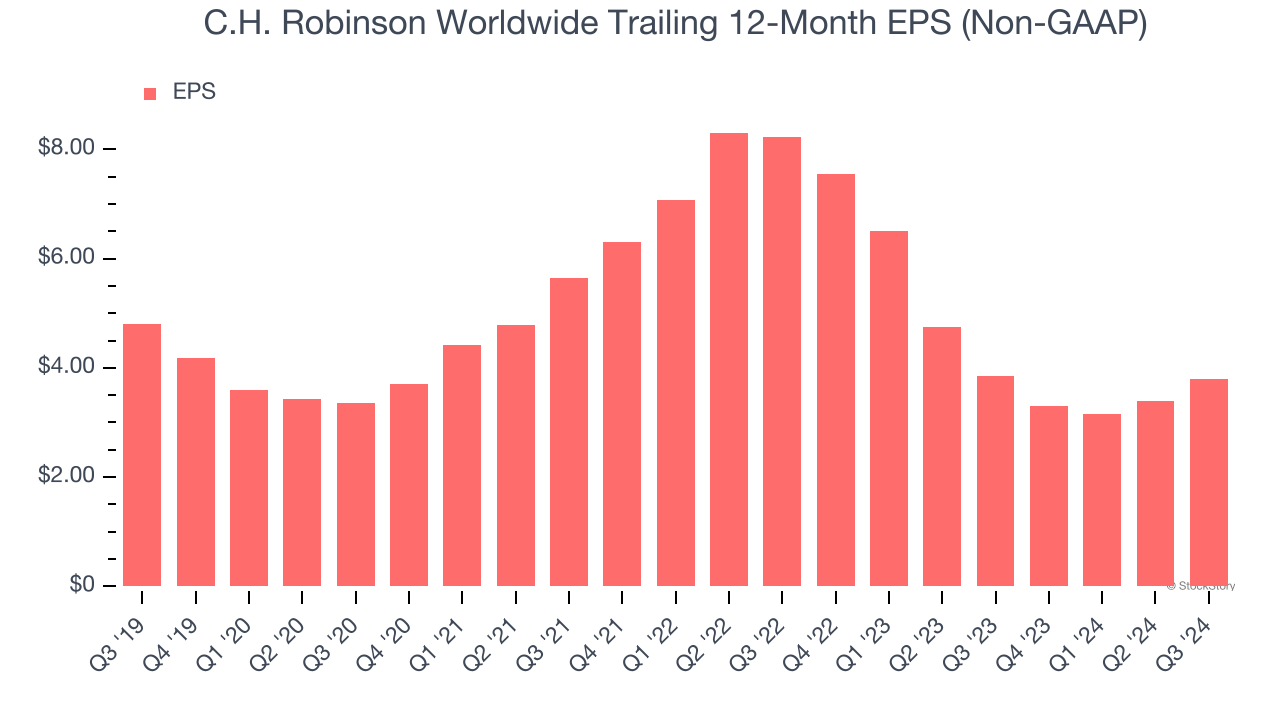
2. EPS Trending Down
We track the long-term change in earnings per share (EPS) because it highlights whether a company’s growth is profitable.
Sadly for C.H. Robinson Worldwide, its EPS declined by 4.6% annually over the last five years while its revenue grew by 2.6%. This tells us the company became less profitable on a per-share basis as it expanded.
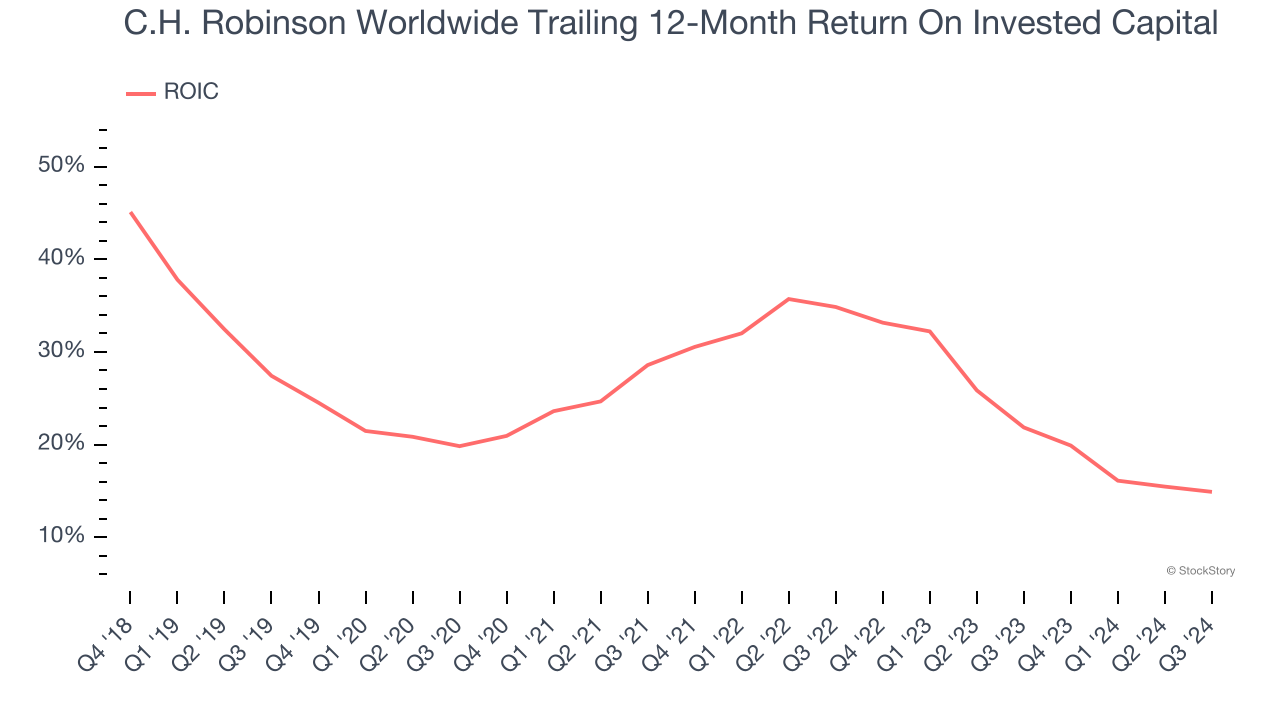
3. New Investments Fail to Bear Fruit as ROIC Declines
A company’s ROIC, or return on invested capital, shows how much operating profit it makes compared to the money it has raised (debt and equity).
We typically prefer to invest in companies with high returns because it means they have viable business models, but the trend in a company’s ROIC is often what surprises the market and moves the stock price. Unfortunately, C.H. Robinson Worldwide’s ROIC has decreased over the last few years. We like what management has done in the past, but its declining returns are perhaps a symptom of fewer profitable growth opportunities.
Final Judgment
We see the value of companies helping their customers, but in the case of C.H. Robinson Worldwide, we’re out. With its shares beating the market recently, the stock trades at 22.8× forward price-to-earnings (or $103.51 per share). This multiple tells us a lot of good news is priced in - we think there are better stocks to buy right now. We’d recommend looking at Yum! Brands, an all-weather company that owns household favorite Taco Bell.
Stocks We Like More Than C.H. Robinson Worldwide
With rates dropping, inflation stabilizing, and the elections in the rearview mirror, all signs point to the start of a new bull run - and we’re laser-focused on finding the best stocks for this upcoming cycle.
Put yourself in the driver’s seat by checking out our Top 6 Stocks for this week. This is a curated list of our High Quality stocks that have generated a market-beating return of 175% over the last five years.
Stocks that made our list in 2019 include now familiar names such as Nvidia (+2,691% between September 2019 and September 2024) as well as under-the-radar businesses like Comfort Systems (+783% five-year return). Find your next big winner with StockStory today for free.