Silgan Holdings has had an impressive run over the past six months as its shares have beaten the S&P 500 by 10.4%. The stock now trades at $52.96, marking a 20.7% gain. This run-up might have investors contemplating their next move.
Is there a buying opportunity in Silgan Holdings, or does it present a risk to your portfolio? See what our analysts have to say in our full research report, it’s free.Despite the momentum, we don't have much confidence in Silgan Holdings. Here are three reasons why there are better opportunities than SLGN and a stock we'd rather own.
Why Do We Think Silgan Holdings Will Underperform?
Established in 1987, Silgan Holdings (NYSE: SLGN) is a supplier of rigid packaging for consumer goods products, specializing in metal containers, closures, and plastic packaging.
1. Long-Term Revenue Growth Disappoints
Reviewing a company’s long-term sales performance reveals insights into its quality. Any business can have short-term success, but a top-tier one grows for years. Unfortunately, Silgan Holdings’s 5.1% annualized revenue growth over the last five years was tepid. This was below our standard for the industrials sector. 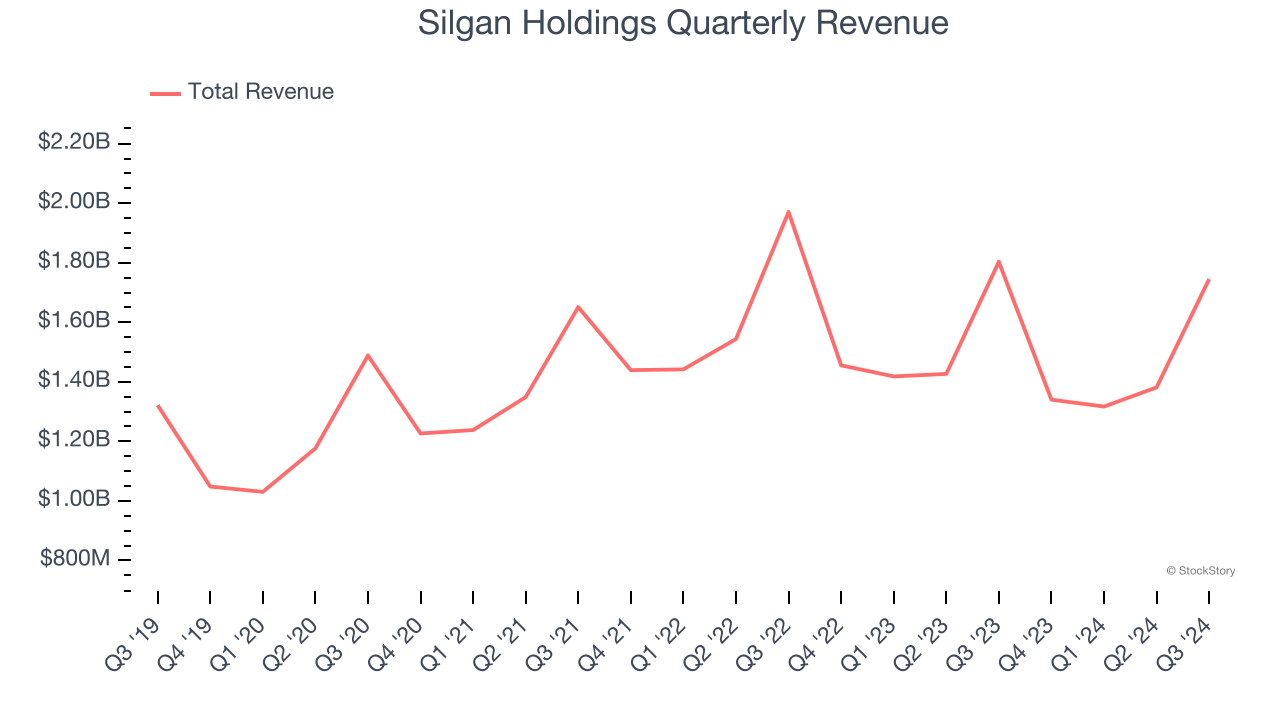
2. Core Business Falling Behind as Demand Declines
Investors interested in Industrial Packaging companies should track organic revenue in addition to reported revenue. This metric gives visibility into Silgan Holdings’s core business because it excludes one-time events such as mergers, acquisitions, and divestitures along with foreign currency fluctuations - non-fundamental factors that can manipulate the income statement.
Over the last two years, Silgan Holdings’s organic revenue averaged 4.5% year-on-year declines. This performance was underwhelming and implies it may need to improve its products, pricing, or go-to-market strategy. It also suggests Silgan Holdings might have to lean into acquisitions to grow, which isn’t ideal because M&A can be expensive and risky (integrations often disrupt focus). 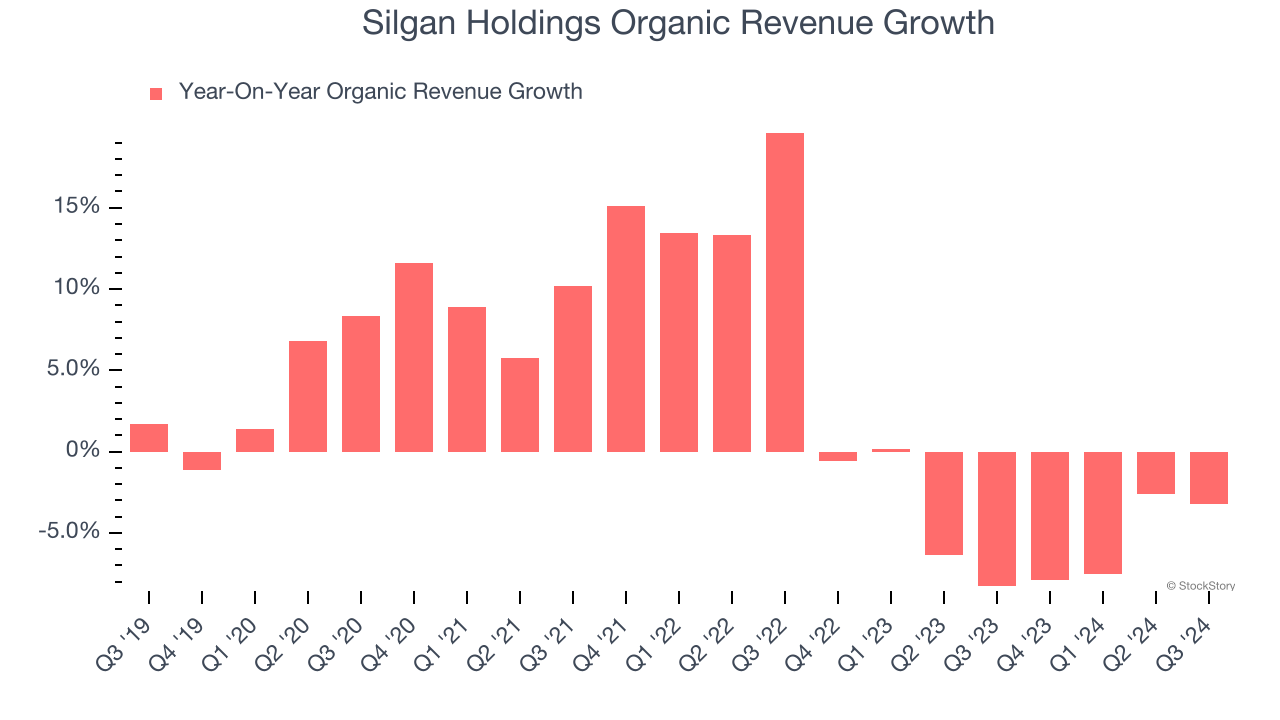
3. EPS Took a Dip Over the Last Two Years
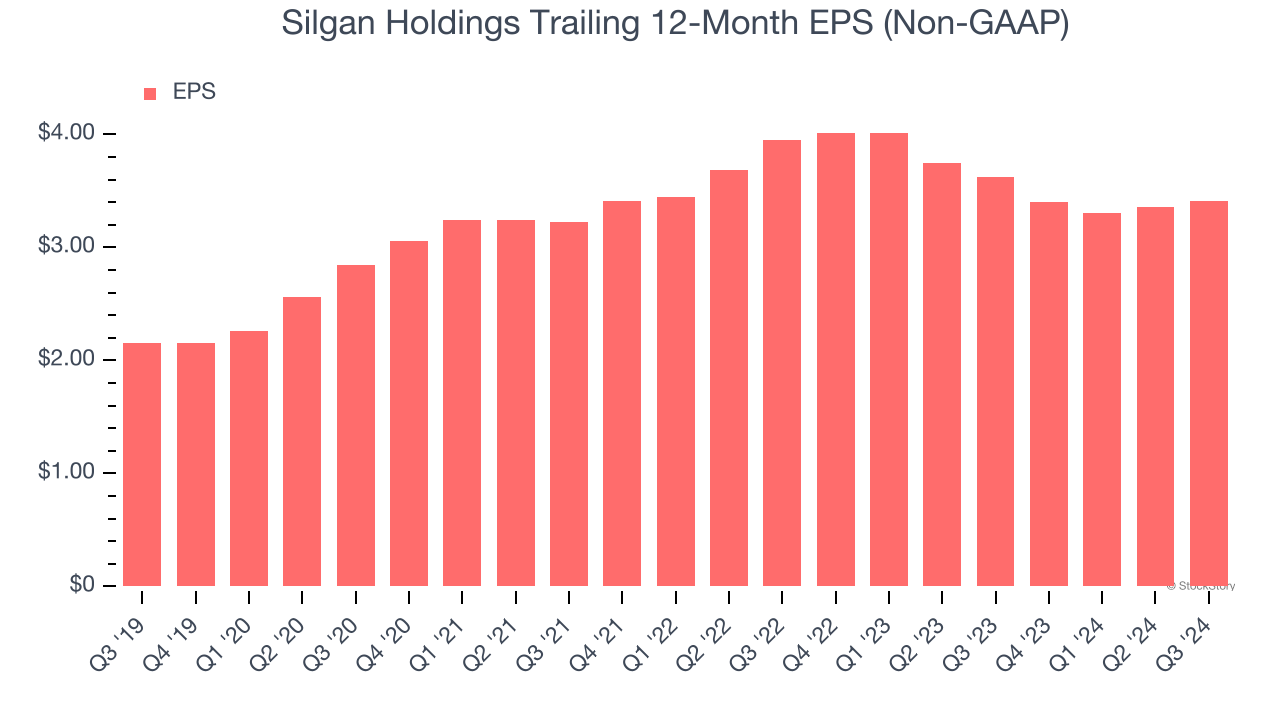
Although long-term earnings trends give us the big picture, we like to analyze EPS over a shorter period to see if we are missing a change in the business.
Sadly for Silgan Holdings, its EPS declined by more than its revenue over the last two years, dropping 7.1%. This tells us the company struggled to adjust to shrinking demand.
Final Judgment
We cheer for all companies making their customers lives easier, but in the case of Silgan Holdings, we’ll be cheering from the sidelines. With its shares topping the market in recent months, the stock trades at 12.6× forward price-to-earnings (or $52.96 per share). This valuation is reasonable, but the company’s shaky fundamentals present too much downside risk. There are superior stocks to buy right now. Let us point you toward Meta, a top digital advertising platform riding the creator economy.
Stocks We Would Buy Instead of Silgan Holdings
With rates dropping, inflation stabilizing, and the elections in the rearview mirror, all signs point to the start of a new bull run - and we’re laser-focused on finding the best stocks for this upcoming cycle.
Put yourself in the driver’s seat by checking out our Top 5 Growth Stocks for this month. This is a curated list of our High Quality stocks that have generated a market-beating return of 175% over the last five years.
Stocks that made our list in 2019 include now familiar names such as Nvidia (+2,691% between September 2019 and September 2024) as well as under-the-radar businesses like United Rentals (+550% five-year return). Find your next big winner with StockStory today for free.