
Bowlero currently trades at $12.41 per share and has shown little upside over the past six months, posting a small loss of 4.1%. The stock also fell short of the S&P 500’s 14.4% gain during that period.
Is there a buying opportunity in Bowlero, or does it present a risk to your portfolio? See what our analysts have to say in our full research report, it’s free.We're cautious about Bowlero. Here are three reasons why we avoid BOWL and a stock we'd rather own.
Why Do We Think Bowlero Will Underperform?
Operating over 300 locations globally, Bowlero (NYSE: BOWL) is a contemporary bowling company merging classic lanes with entertainment and deluxe food offerings.
1. Same-Store Sales Falling Behind Peers
In addition to reported revenue, same-store sales are a useful data point for analyzing Leisure Facilities companies. This metric measures the change in sales at brick-and-mortar locations that have existed for at least a year, giving visibility into Bowlero’s underlying demand characteristics.
Over the last two years, Bowlero’s same-store sales averaged 5.1% year-on-year growth. This performance was underwhelming and suggests it might have to change its strategy or pricing, which can disrupt operations. 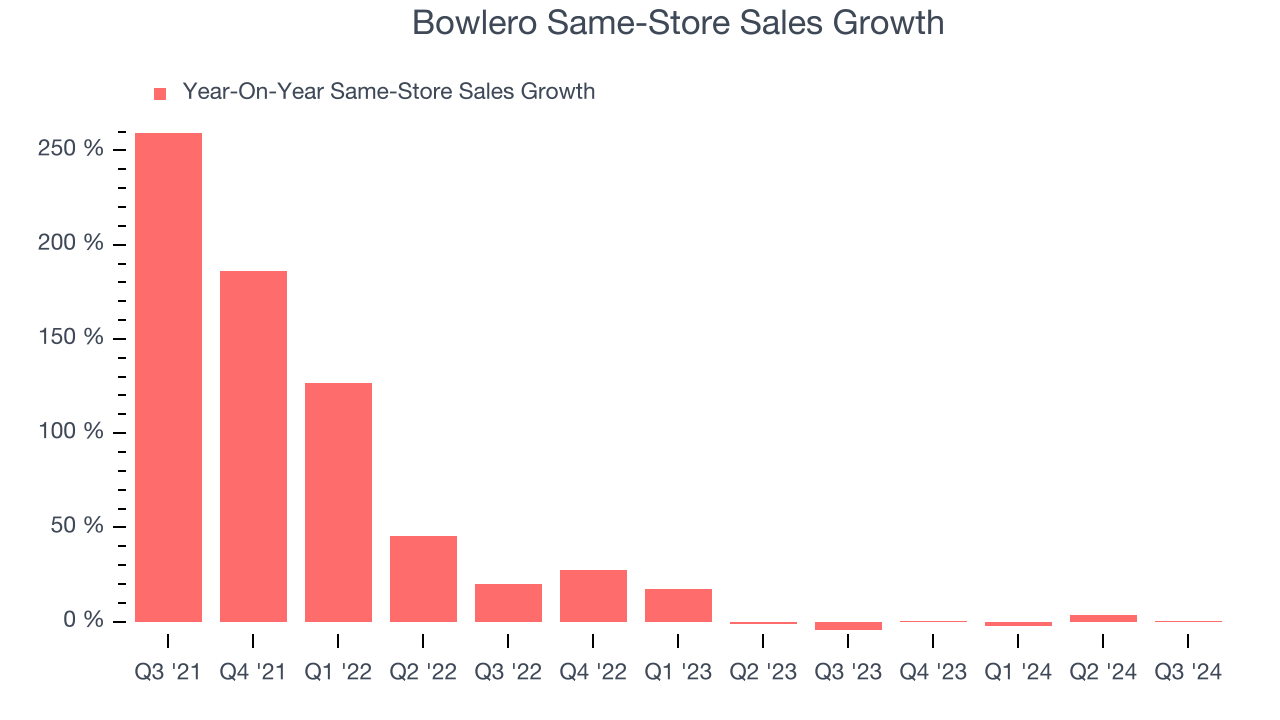
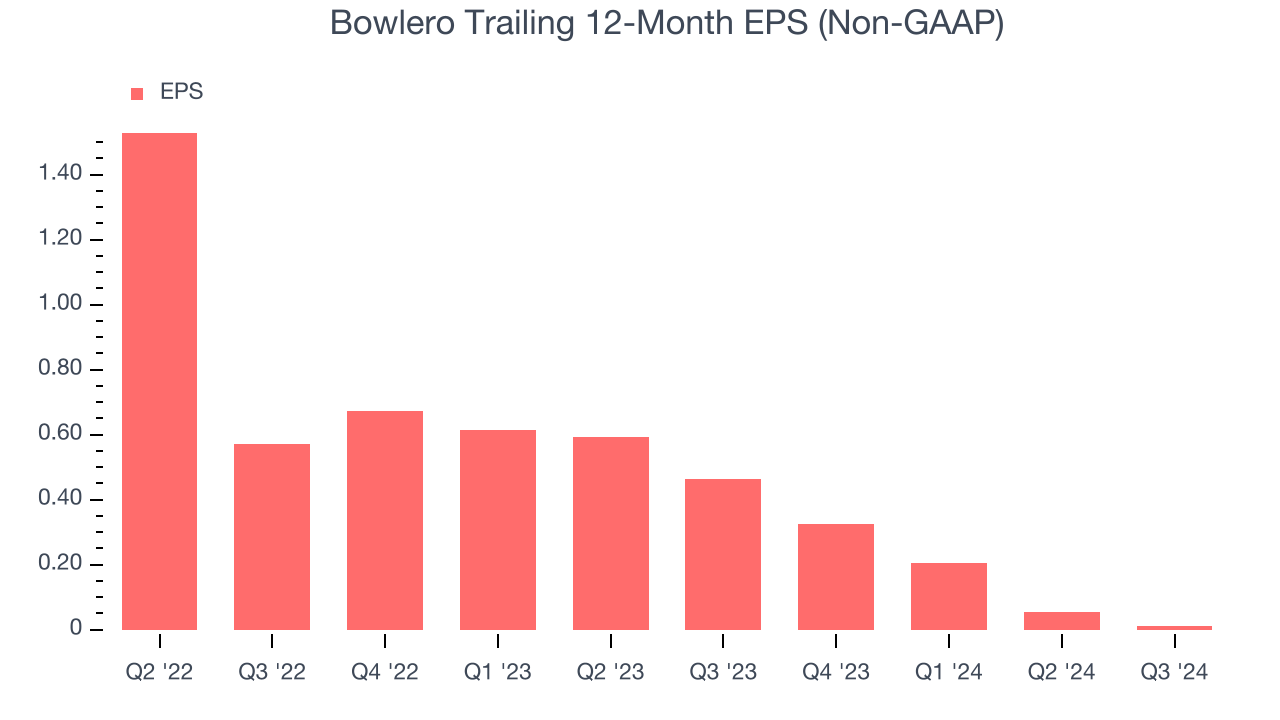
2. EPS Trending Down
We track the change in earnings per share (EPS) because it highlights whether a company’s growth is profitable.
Bowlero’s full-year EPS dropped significantly over the last two years. We tend to steer our readers away from companies with falling revenue and EPS, where diminishing earnings could imply changing secular trends and preferences. Consumer Discretionary companies are particularly exposed to this, and if the tide turns unexpectedly, Bowlero’s low margin of safety could leave its stock price susceptible to large downswings.
3. Short Runway Exposes Shareholders to Potential Dilution
As long-term investors, the risk we care about most is the permanent loss of capital, which can happen when a company goes bankrupt or raises money from a disadvantaged position. This is separate from short-term stock price volatility, something we are much less bothered by.
Bowlero burned through $17.06 million of cash over the last year, and its $2.39 billion of debt exceeds the $38.45 million of cash on its balance sheet. This is a deal breaker for us because indebted loss-making companies spell trouble.
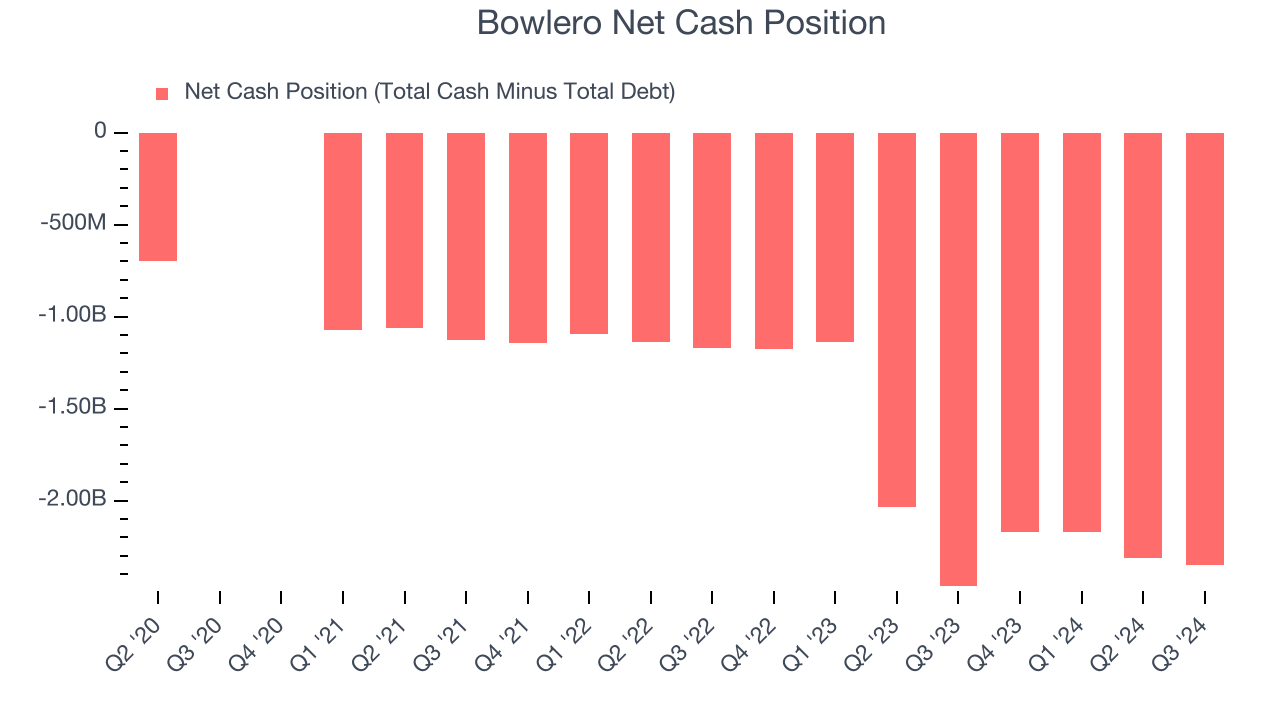
Unless the Bowlero’s fundamentals change quickly, it might find itself in a position where it must raise capital from investors to continue operating. Whether that would be favorable is unclear because dilution is a headwind for shareholder returns.
We remain cautious of Bowlero until it generates consistent free cash flow or any of its announced financing plans materialize on its balance sheet.
Final Judgment
Bowlero falls short of our quality standards. With its shares trailing the market in recent months, the stock trades at 41.8x forward price-to-earnings (or $12.41 per share). While this valuation is reasonable, we don’t see a big opportunity at the moment. There are more exciting stocks to buy at the moment. Let us point you toward ServiceNow, one of our all-time favorite software stocks with a durable competitive moat.
Stocks We Would Buy Instead of Bowlero
With rates dropping, inflation stabilizing, and the elections in the rearview mirror, all signs point to the start of a new bull run - and we’re laser-focused on finding the best stocks for this upcoming cycle.
Put yourself in the driver’s seat by checking out our Top 5 Growth Stocks for this month. This is a curated list of our High Quality stocks that have generated a market-beating return of 175% over the last five years.
Stocks that made our list in 2019 include now familiar names such as Nvidia (+2,691% between September 2019 and September 2024) as well as under-the-radar businesses like Comfort Systems (+783% five-year return). Find your next big winner with StockStory today for free.