
Lindblad Expeditions has been on fire lately. In the past six months alone, the company’s stock price has rocketed 81.4%, reaching $13.84 per share. This was partly due to its solid quarterly results, and the performance may have investors wondering how to approach the situation.
Is there a buying opportunity in Lindblad Expeditions, or does it present a risk to your portfolio? Dive into our full research report to see our analyst team’s opinion, it’s free.We’re glad investors have benefited from the price increase, but we don't have much confidence in Lindblad Expeditions. Here are three reasons why LIND doesn't excite us and a stock we'd rather own.
Why Do We Think Lindblad Expeditions Will Underperform?
Founded by explorer Sven-Olof Lindblad in 1979, Lindblad Expeditions (NASDAQ: LIND) offers cruising experiences to remote destinations in partnership with National Geographic.
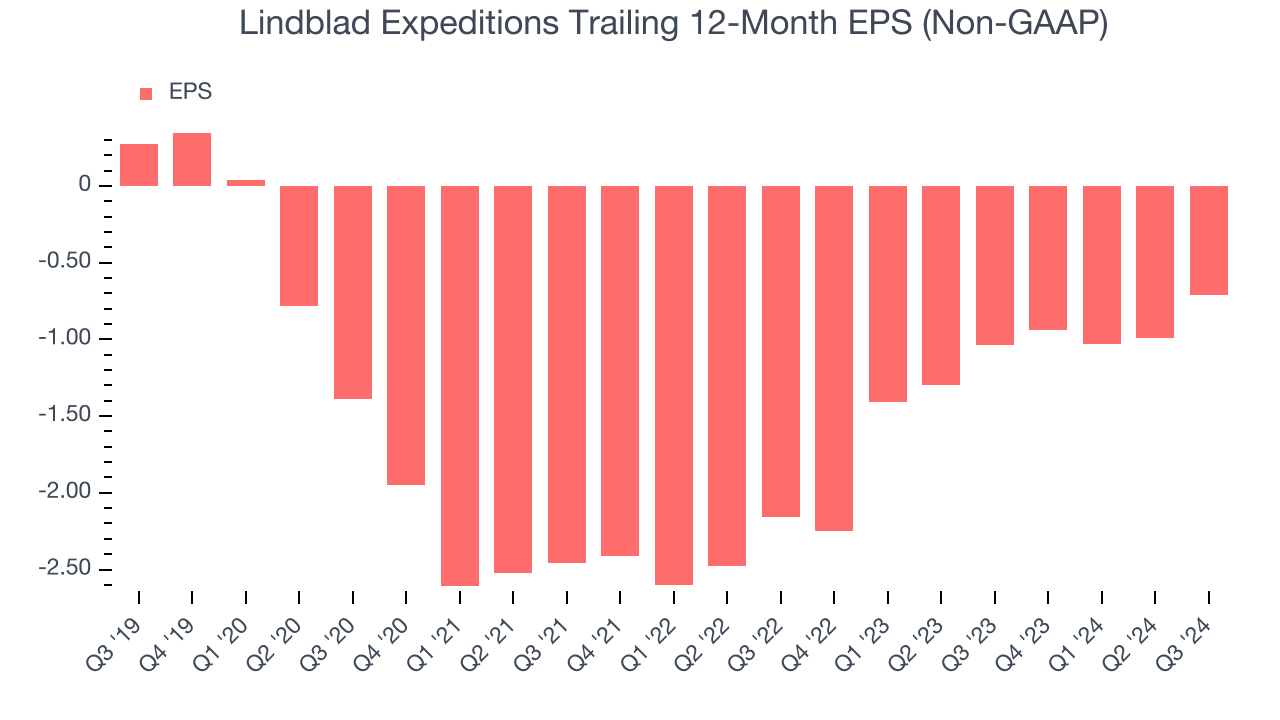
1. EPS Trending Down
We track the long-term change in earnings per share (EPS) because it highlights whether a company’s growth is profitable.
Sadly for Lindblad Expeditions, its EPS declined by 35.8% annually over the last five years while its revenue grew by 13%. This tells us the company became less profitable on a per-share basis as it expanded.
2. Cash Flow Margin Set to Decline
If you’ve followed StockStory for a while, you know we emphasize free cash flow. Why, you ask? We believe that in the end, cash is king, and you can’t use accounting profits to pay the bills.
Over the next year, analysts predict Lindblad Expeditions’s cash conversion will fall. Their consensus estimates imply its free cash flow margin of 8% for the last 12 months will decrease to 4.9%.
3. Previous Growth Initiatives Have Lost Money
Growth gives us insight into a company’s long-term potential, but how capital-efficient was that growth? Enter ROIC, a metric showing how much operating profit a company generates relative to the money it has raised (debt and equity).
Lindblad Expeditions’s five-year average ROIC was negative 15.2%, meaning management lost money while trying to expand the business. Its returns were among the worst in the consumer discretionary sector.
Final Judgment
Lindblad Expeditions doesn’t pass our quality test. After the recent rally, the stock trades at 7.8x forward EV-to-EBITDA (or $13.84 per share). At this valuation, there’s a lot of good news priced in - we think there are better opportunities elsewhere. Let us point you toward MercadoLibre, the Amazon and PayPal of Latin America.
Stocks We Like More Than Lindblad Expeditions
The Trump trade may have passed, but rates are still dropping and inflation is still cooling. Opportunities are ripe for those ready to act - and we’re here to help you pick them.
Get started by checking out our Top 5 Growth Stocks for this month. This is a curated list of our High Quality stocks that have generated a market-beating return of 175% over the last five years.
Stocks that made our list in 2019 include now familiar names such as Nvidia (+2,691% between September 2019 and September 2024) as well as under-the-radar businesses like Comfort Systems (+783% five-year return). Find your next big winner with StockStory today for free.