ETFOptimize | High-performance ETF-based Investment Strategies

Quantitative strategies, Wall Street-caliber research, and insightful market analysis since 1998.


ETFOptimize | HOME
Close Window

Crocs (CROX): Buy, Sell, or Hold Post Q3 Earnings?

CROX Cover Image

Crocs’s stock price has taken a beating over the past six months, shedding 26.8% of its value and falling to $108.22 per share. This may have investors wondering how to approach the situation.

Following the drawdown, is now an opportune time to buy CROX? Find out in our full research report, it’s free.

Why Does CROX Stock Spark Debate?

Founded in 2002, Crocs (NASDAQ: CROX) sells casual footwear and is known for its iconic clog shoe.

Two Things to Like:

1. Skyrocketing Revenue Shows Strong Momentum

A company’s long-term performance is an indicator of its overall quality. While any business can experience short-term success, top-performing ones enjoy sustained growth for years. Luckily, Crocs’s sales grew at an exceptional 28% compounded annual growth rate over the last five years. Its growth beat the average consumer discretionary company and shows its offerings resonate with customers. Crocs Quarterly Revenue

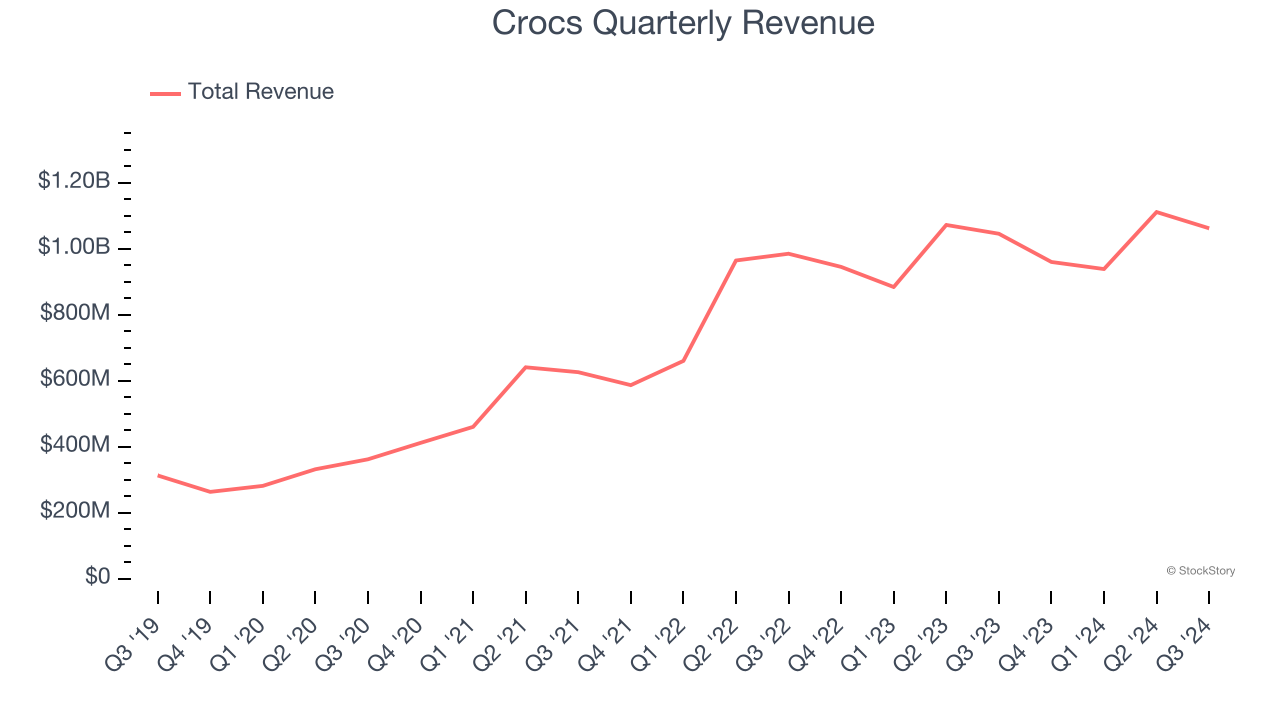
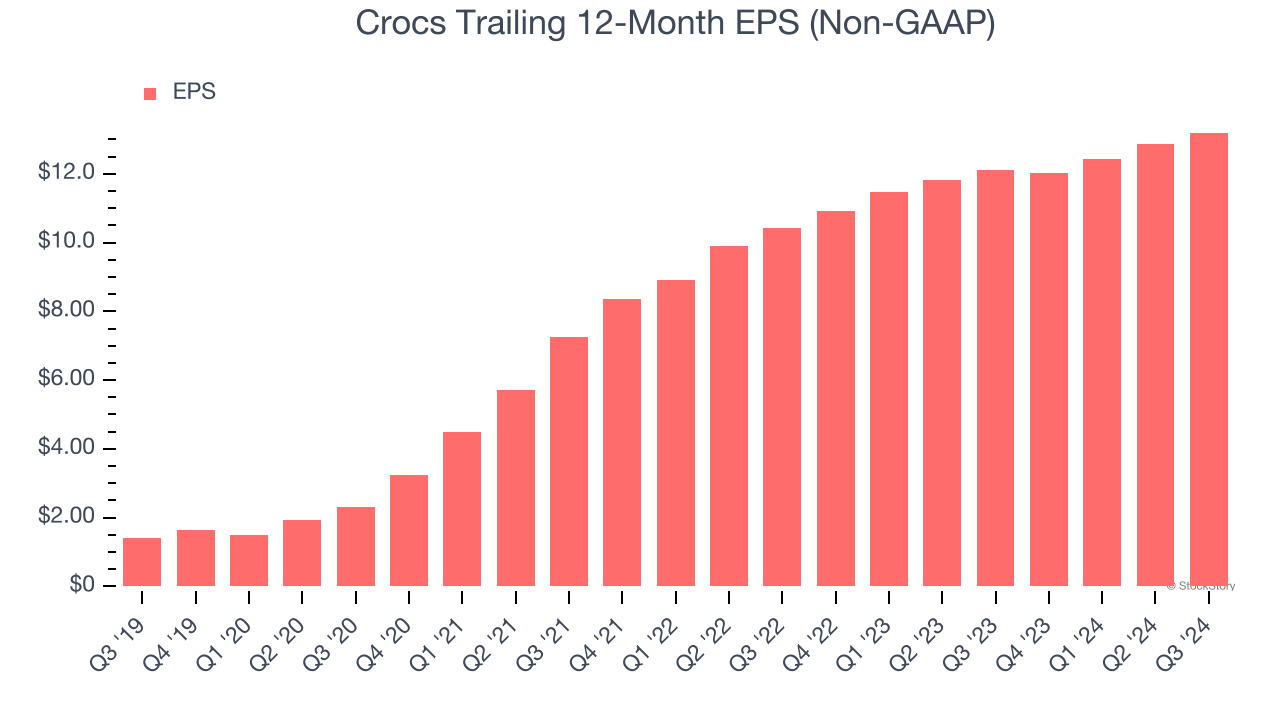
2. Outstanding Long-Term EPS Growth

We track the long-term change in earnings per share (EPS) because it highlights whether a company’s growth is profitable.

Crocs’s EPS grew at an astounding 56.2% compounded annual growth rate over the last five years, higher than its 28% annualized revenue growth. This tells us the company became more profitable on a per-share basis as it expanded.

Crocs Trailing 12-Month EPS (Non-GAAP)

One Reason to be Careful:

Weak Constant Currency Growth Points to Soft Demand

Investors interested in Footwear companies should track constant currency revenue in addition to reported revenue. This metric excludes currency movements, which are outside of Crocs’s control and are not indicative of underlying demand.

Over the last two years, Crocs’s constant currency revenue averaged 13.9% year-on-year growth. This performance slightly lagged the sector and suggests it might have to lower prices or invest in product improvements to accelerate growth, factors that can hinder near-term profitability.
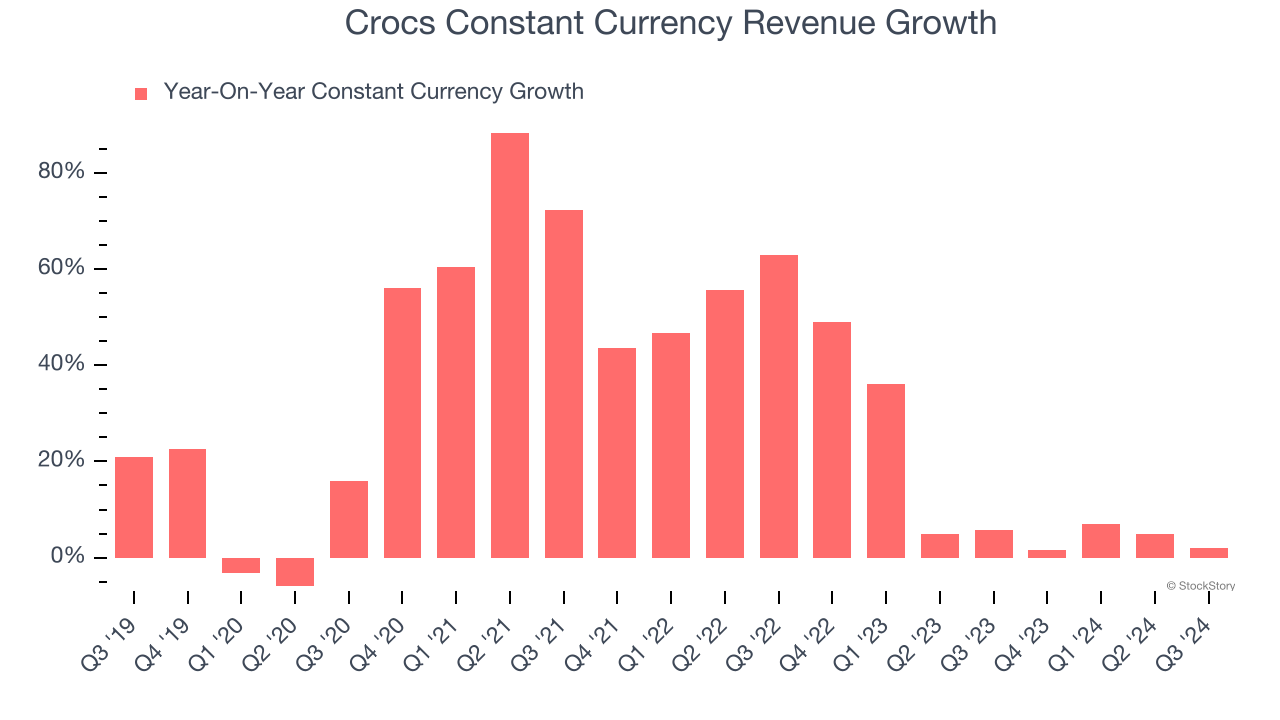
 Crocs Constant Currency Revenue Growth

Final Judgment

Crocs’s positive characteristics outweigh the negatives. With the recent decline, the stock trades at 7.9× forward price-to-earnings (or $108.22 per share). Is now a good time to buy? See for yourself in our comprehensive research report, it’s free.

Stocks We Like Even More Than Crocs

The Trump trade may have passed, but rates are still dropping and inflation is still cooling. Opportunities are ripe for those ready to act - and we’re here to help you pick them.

Get started by checking out our Top 9 Market-Beating Stocks. This is a curated list of our High Quality stocks that have generated a market-beating return of 175% over the last five years.

Stocks that made our list in 2019 include now familiar names such as Nvidia (+2,691% between September 2019 and September 2024) as well as under-the-radar businesses like United Rentals (+550% five-year return). Find your next big winner with StockStory today for free.

Recent Quotes

View More
Symbol Price Change (%)
AMZN  229.58
+0.47 (0.21%)
AAPL  279.17
-1.53 (-0.55%)
AMD  218.39
+2.41 (1.12%)
BAC  53.99
+0.11 (0.20%)
GOOG  321.07
+2.68 (0.84%)
META  671.17
+9.64 (1.46%)
MSFT  481.37
+0.53 (0.11%)
NVDA  181.41
-1.97 (-1.07%)
ORCL  215.72
+1.39 (0.65%)
TSLA  454.18
-0.35 (-0.08%)
Stock Quote API & Stock News API supplied by www.cloudquote.io
Quotes delayed at least 20 minutes.
By accessing this page, you agree to the Privacy Policy and Terms Of Service.


IntelligentValue Home
Close Window

DISCLAIMER

All content herein is issued solely for informational purposes and is not to be construed as an offer to sell or the solicitation of an offer to buy, nor should it be interpreted as a recommendation to buy, hold or sell (short or otherwise) any security.  All opinions, analyses, and information included herein are based on sources believed to be reliable, but no representation or warranty of any kind, expressed or implied, is made including but not limited to any representation or warranty concerning accuracy, completeness, correctness, timeliness or appropriateness. We undertake no obligation to update such opinions, analysis or information. You should independently verify all information contained on this website. Some information is based on analysis of past performance or hypothetical performance results, which have inherent limitations. We make no representation that any particular equity or strategy will or is likely to achieve profits or losses similar to those shown. Shareholders, employees, writers, contractors, and affiliates associated with ETFOptimize.com may have ownership positions in the securities that are mentioned. If you are not sure if ETFs, algorithmic investing, or a particular investment is right for you, you are urged to consult with a Registered Investment Advisor (RIA). Neither this website nor anyone associated with producing its content are Registered Investment Advisors, and no attempt is made herein to substitute for personalized, professional investment advice. Neither ETFOptimize.com, Global Alpha Investments, Inc., nor its employees, service providers, associates, or affiliates are responsible for any investment losses you may incur as a result of using the information provided herein. Remember that past investment returns may not be indicative of future returns.

Copyright © 1998-2017 ETFOptimize.com, a publication of Optimized Investments, Inc. All rights reserved.