Qualys currently trades at $138.99 per share and has shown little upside over the past six months, posting a small loss of 2.3%. The stock also fell short of the S&P 500’s 7.8% gain during that period.
Is now the time to buy Qualys, or should you be careful about including it in your portfolio? Get the full stock story straight from our expert analysts, it’s free.We don't have much confidence in Qualys. Here are three reasons why QLYS doesn't excite us and a stock we'd rather own.
Why Is Qualys Not Exciting?
Founded in 1999 as one of the first subscription security companies, Qualys (NASDAQ: QLYS) provides organizations with software to assess their exposure to cyber-attacks.
1. Long-Term Revenue Growth Disappoints
Reviewing a company’s long-term sales performance reveals insights into its quality. Any business can have short-term success, but a top-tier one grows for years. Over the last three years, Qualys grew its sales at a 14.4% annual rate. Although this growth is solid on an absolute basis, it fell short of our benchmark for the software sector. 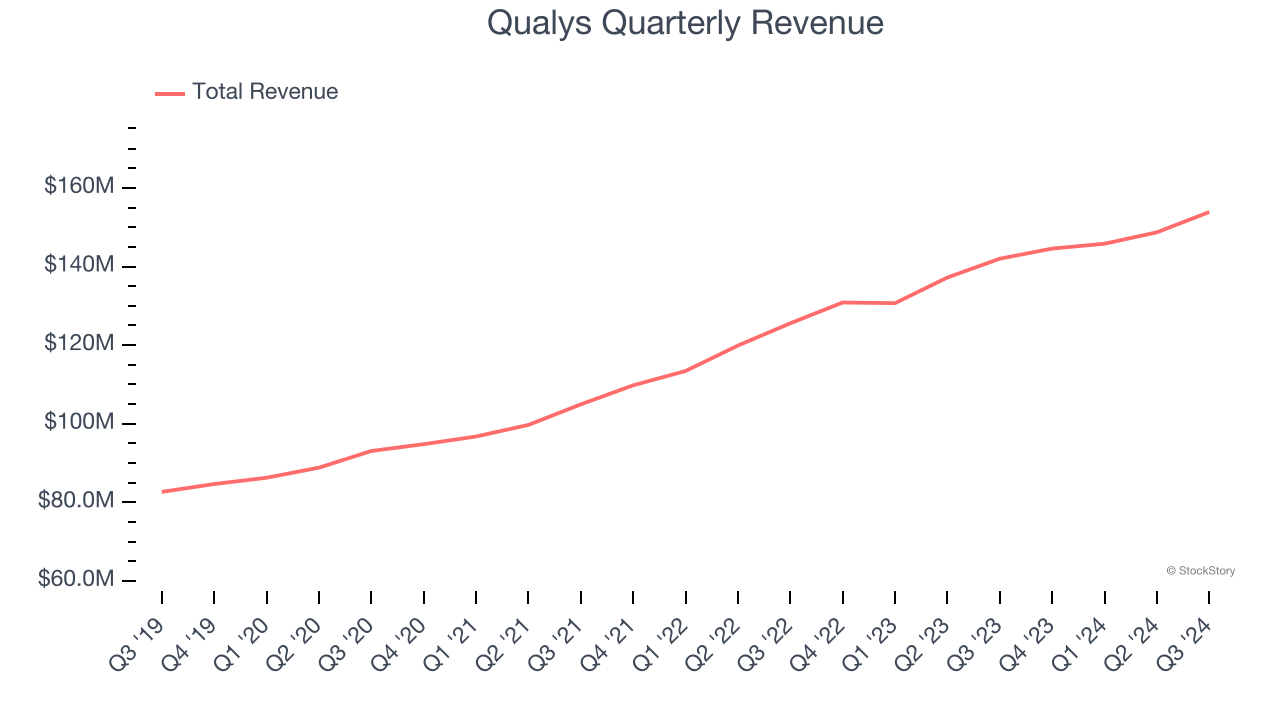
2. Weak Billings Point to Soft Demand
Billings is a non-GAAP metric that is often called “cash revenue” because it shows how much money the company has collected from customers in a certain period. This is different from revenue, which must be recognized in pieces over the length of a contract.
Qualys’s billings came in at $161.7 million in Q3, and over the last four quarters, its year-on-year growth averaged 6.9%. This performance was underwhelming and suggests that increasing competition is causing challenges in acquiring/retaining customers. 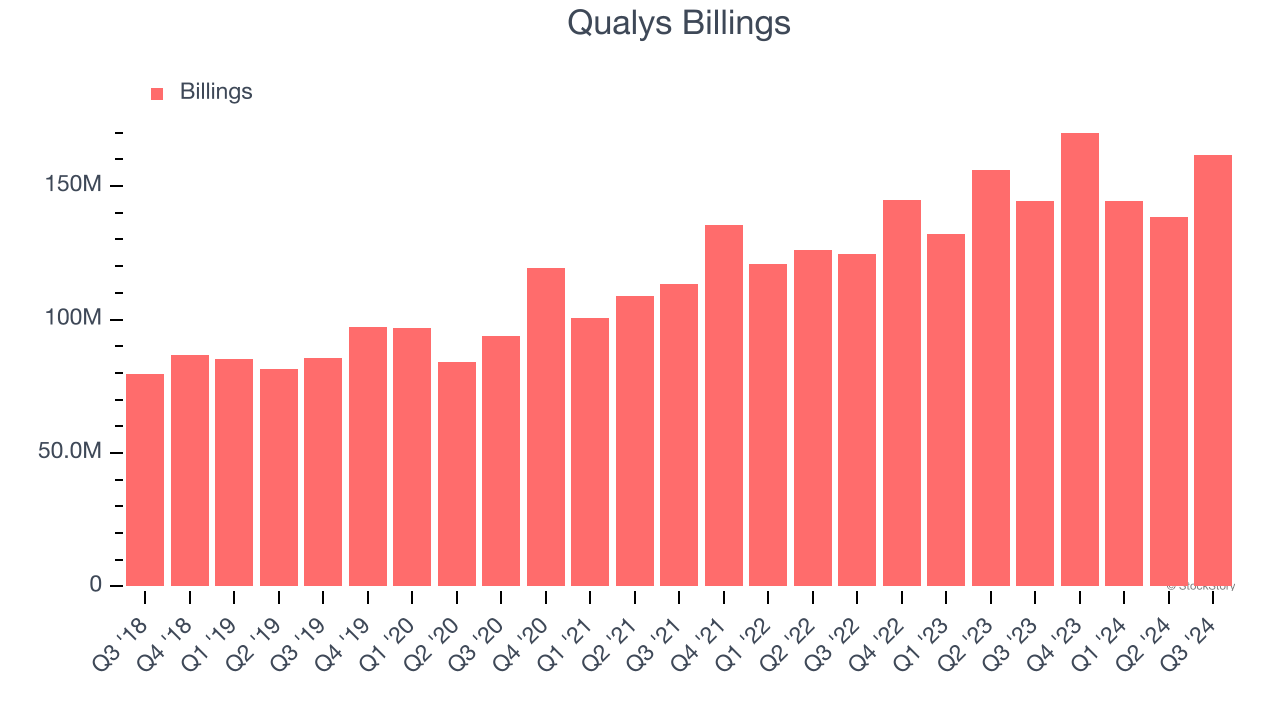
3. Cash Flow Margin Set to Decline
If you’ve followed StockStory for a while, you know we emphasize free cash flow. Why, you ask? We believe that in the end, cash is king, and you can’t use accounting profits to pay the bills.
Over the next year, analysts predict Qualys’s cash conversion will slightly fall. Their consensus estimates imply its free cash flow margin of 37.5% for the last 12 months will decrease to 35.6%.
Final Judgment
Qualys isn’t a terrible business, but it doesn’t pass our quality test. With its shares underperforming the market lately, the stock trades at 8.2× forward price-to-sales (or $138.99 per share). This valuation tells us a lot of optimism is priced in - we think there are better opportunities elsewhere. We’d recommend looking at Uber, whose profitability just reached an inflection point.
Stocks We Like More Than Qualys
The elections are now behind us. With rates dropping and inflation cooling, many analysts expect a breakout market to cap off the year - and we’re zeroing in on the stocks that could benefit immensely.
Take advantage of the rebound by checking out our Top 9 Market-Beating Stocks. This is a curated list of our High Quality stocks that have generated a market-beating return of 175% over the last five years.
Stocks that made our list in 2019 include now familiar names such as Nvidia (+2,691% between September 2019 and September 2024) as well as under-the-radar businesses like United Rentals (+550% five-year return). Find your next big winner with StockStory today for free.