
What a fantastic six months it’s been for Sprouts. Shares of the company have skyrocketed 52.3%, hitting $127.29. This was partly due to its solid quarterly results, and the performance may have investors wondering how to approach the situation.
Following the strength, is SFM a buy right now? Or is the market overestimating its value? Find out in our full research report, it’s free.
Why Does SFM Stock Spark Debate?
Playing on the secular trend of healthier living, Sprouts Farmers Market (NASDAQ: SFM) is a grocery store chain emphasizing natural and organic products.
Two Positive Attributes:
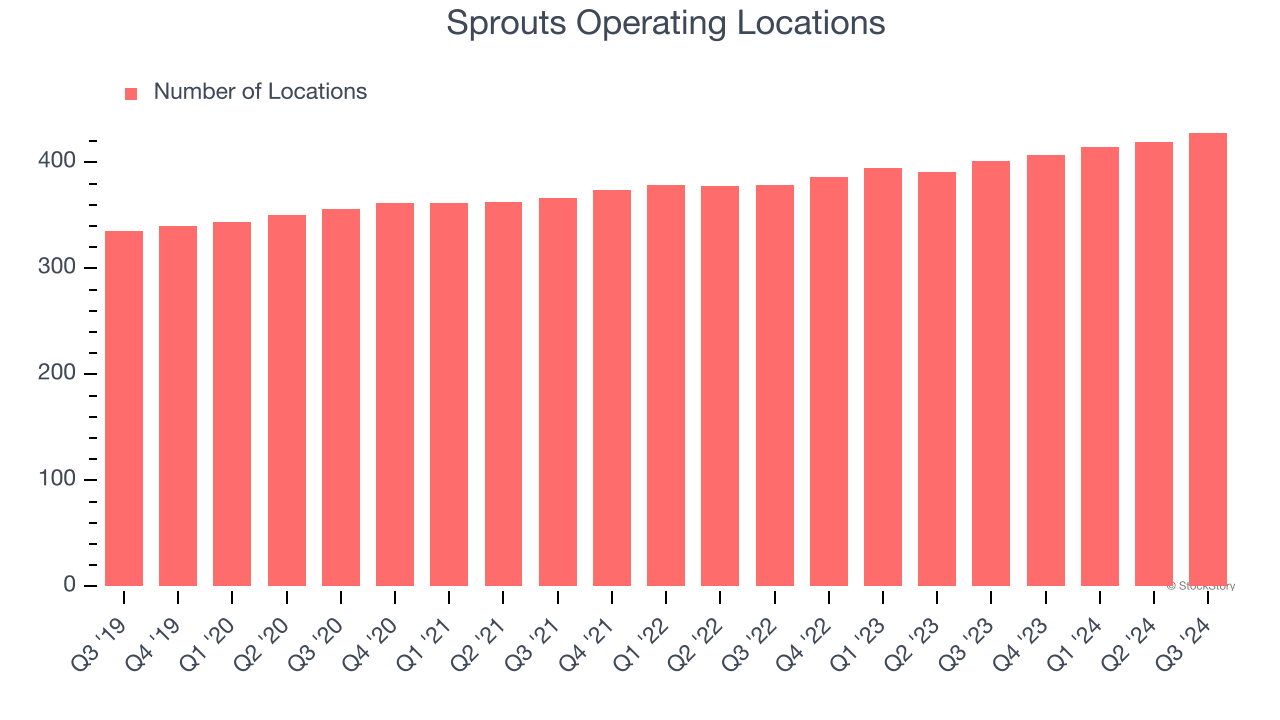
1. Store Growth Signals an Offensive Strategy
The number of stores a retailer operates is a critical driver of how quickly company-level sales can grow.
Sprouts sported 428 locations in the latest quarter. Over the last two years, it has opened new stores at a rapid clip by averaging 5.1% annual growth, among the fastest in the consumer retail sector. This gives it a chance to become a large, scaled business over time.
When a retailer opens new stores, it usually means it’s investing for growth because demand is greater than supply, especially in areas where consumers may not have a store within reasonable driving distance.
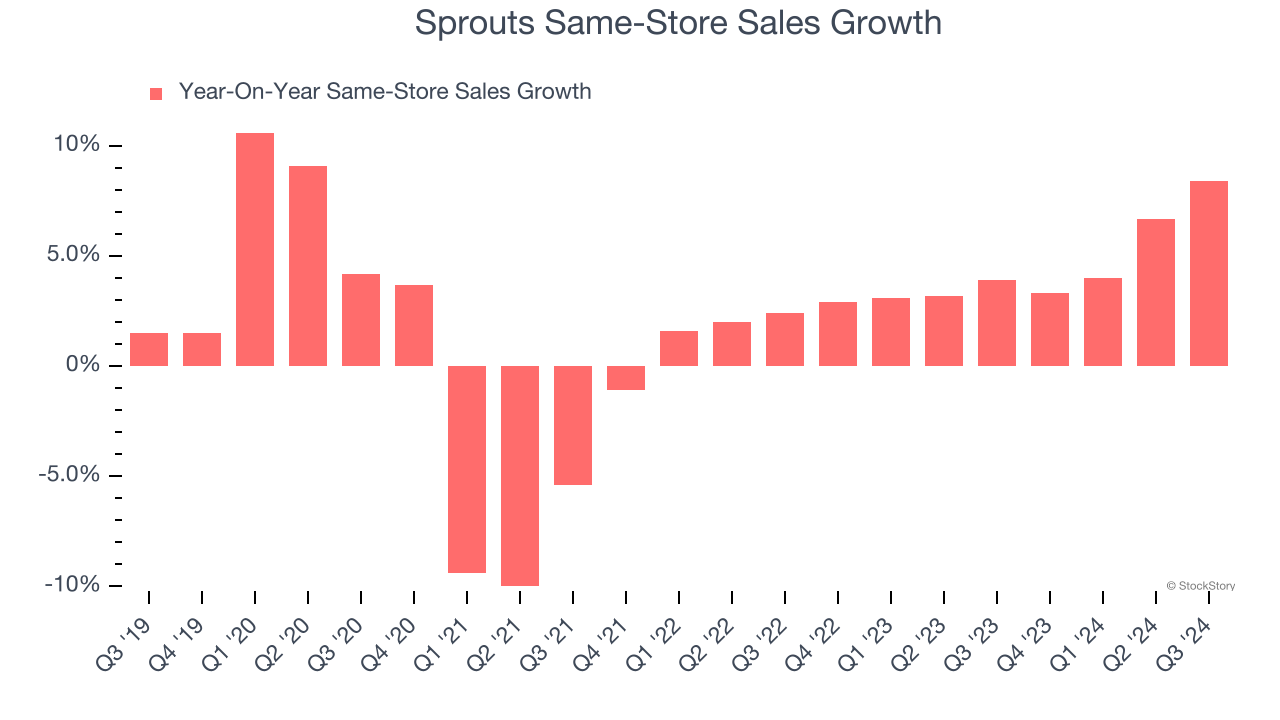
2. Surging Same-Store Sales Show Increasing Demand
Same-store sales show the change in sales for a retailer's e-commerce platform and brick-and-mortar shops that have existed for at least a year. This is a key performance indicator because it measures organic growth.
Sprouts has been one of the most successful retailers over the last two years thanks to skyrocketing demand within its existing locations. On average, the company has posted exceptional year-on-year same-store sales growth of 4.4%.
One Reason to be Careful:
Long-Term Revenue Growth Disappoints
A company’s long-term sales performance signals its overall quality. Even a bad business can shine for one or two quarters, but a top-tier one grows for years. Over the last five years, Sprouts grew its sales at a tepid 6% compounded annual growth rate. This fell short of our benchmark for the consumer retail sector. 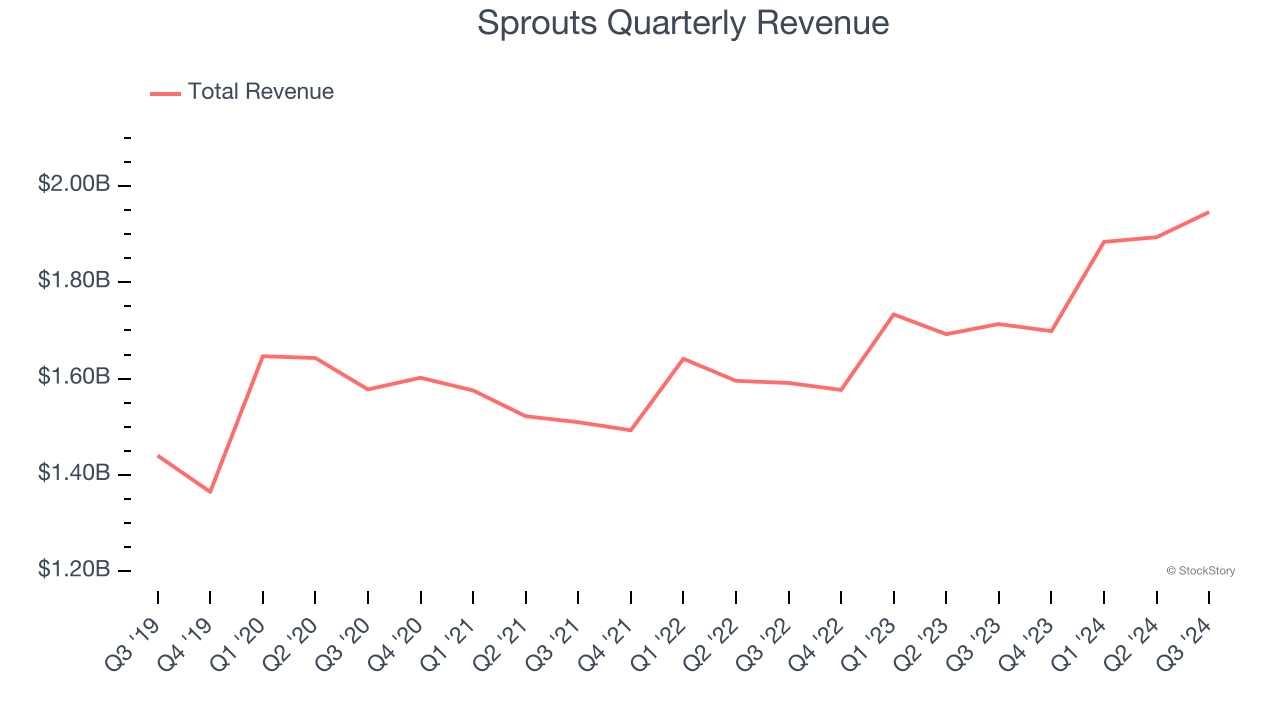
Final Judgment
Sprouts’s merits more than compensate for its flaws, and after the recent surge, the stock trades at 34.2× forward price-to-earnings (or $127.29 per share). Is now a good time to buy despite the apparent froth? See for yourself in our full research report, it’s free.
Stocks We Like Even More Than Sprouts
The elections are now behind us. With rates dropping and inflation cooling, many analysts expect a breakout market to cap off the year - and we’re zeroing in on the stocks that could benefit immensely.
Take advantage of the rebound by checking out our Top 6 Stocks for this week. This is a curated list of our High Quality stocks that have generated a market-beating return of 175% over the last five years.
Stocks that made our list in 2019 include now familiar names such as Nvidia (+2,691% between September 2019 and September 2024) as well as under-the-radar businesses like United Rentals (+550% five-year return). Find your next big winner with StockStory today for free.


