Footwear company Caleres (NYSE: CAL) fell short of the market’s revenue expectations in Q3 CY2024, with sales falling 2.8% year on year to $740.9 million. Its non-GAAP profit of $1.23 per share was 9.2% below analysts’ consensus estimates.
Is now the time to buy Caleres? Find out by accessing our full research report, it’s free.
Caleres (CAL) Q3 CY2024 Highlights:
- Revenue: $740.9 million vs analyst estimates of $751.4 million (2.8% year-on-year decline, 1.4% miss)
- Adjusted EPS: $1.23 vs analyst expectations of $1.36 (9.2% miss)
- Adjusted EBITDA: $73 million vs analyst estimates of $79.39 million (9.9% margin, 8% miss)
- Management lowered its full-year Adjusted EPS guidance to $3.50 at the midpoint, a 14.1% decrease
- Operating Margin: 7.7%, in line with the same quarter last year
- Free Cash Flow was -$58.36 million, down from $13.08 million in the same quarter last year
- Market Capitalization: $1.17 billion
“The third quarter saw progress toward our strategy highlighted by the Brand Portfolio delivering growth, Famous Footwear delivering positive comparable store sales, and both segments increasing market share. That said, performance was below our expectations reflecting softer seasonal demand in the boot category, late receipts of key athletic product at Famous Footwear, and a discrete customer credit issue that impacted shipments. In addition, our business in China was also weaker than planned,” said Jay Schmidt, President and Chief Executive Officer.
Company Overview
The owner of Dr. Scholl's, Caleres (NYSE: CAL) is a footwear company offering a range of styles.
Footwear
Before the advent of the internet, styles changed, but consumers mainly bought shoes by visiting local brick-and-mortar shoe, department, and specialty stores. Today, not only do styles change more frequently as fads travel through social media and the internet but consumers are also shifting the way they buy their goods, favoring omnichannel and e-commerce experiences. Some footwear companies have made concerted efforts to adapt while those who are slower to move may fall behind.
Sales Growth
A company’s long-term sales performance signals its overall quality. Even a bad business can shine for one or two quarters, but a top-tier one grows for years. Over the last five years, Caleres’s demand was weak and its revenue declined by 1.1% per year. This was below our standards and signals it’s a low quality business.
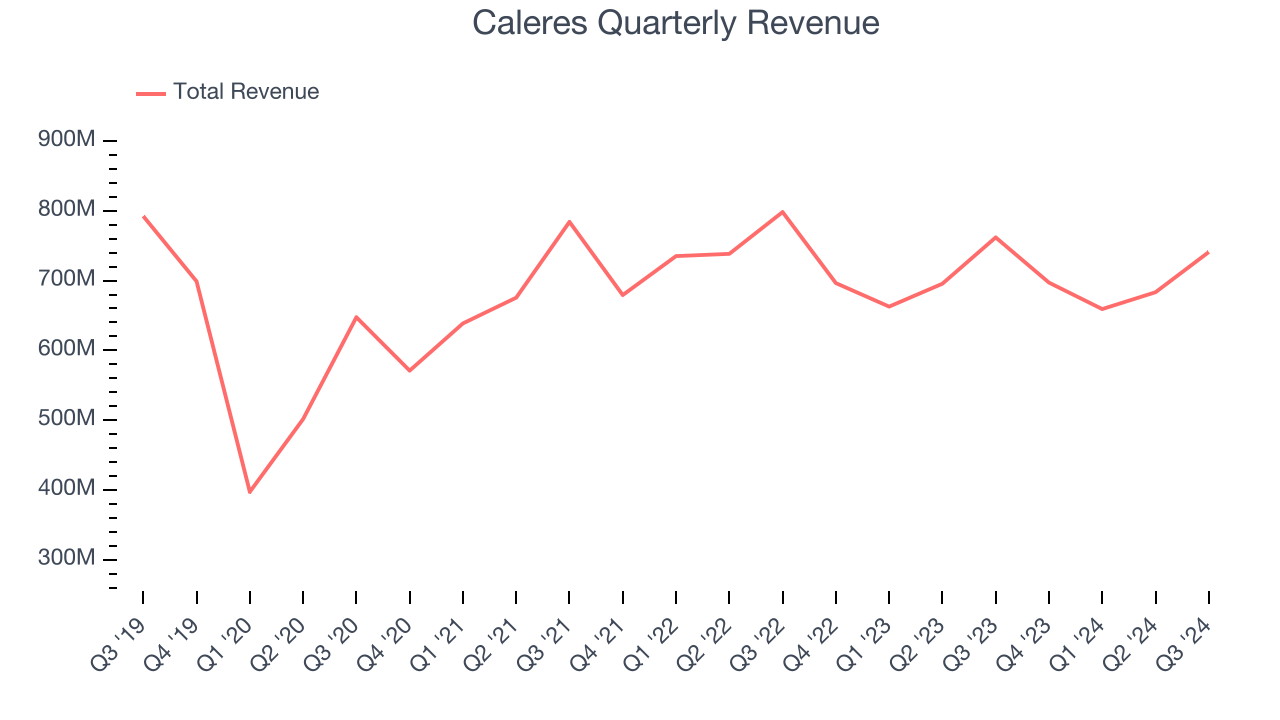
We at StockStory place the most emphasis on long-term growth, but within consumer discretionary, a stretched historical view may miss a company riding a successful new product or trend. Caleres’s recent history shows its demand has stayed suppressed as its revenue has declined by 2.9% annually over the last two years. 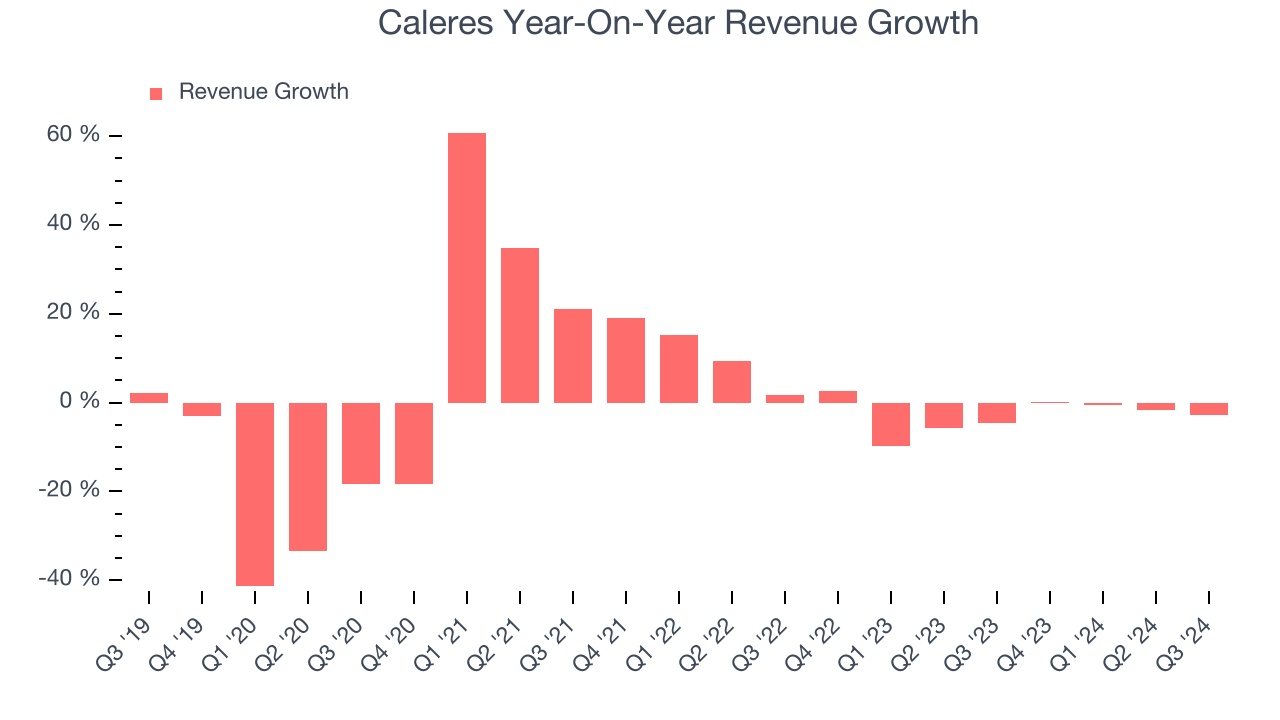
This quarter, Caleres missed Wall Street’s estimates and reported a rather uninspiring 2.8% year-on-year revenue decline, generating $740.9 million of revenue.
Looking ahead, sell-side analysts expect revenue to remain flat over the next 12 months. Although this projection suggests its newer products and services will fuel better top-line performance, it is still below average for the sector.
Unless you’ve been living under a rock, it should be obvious by now that generative AI is going to have a huge impact on how large corporations do business. While Nvidia and AMD are trading close to all-time highs, we prefer a lesser-known (but still profitable) stock benefiting from the rise of AI. Click here to access our free report one of our favorites growth stories.
Cash Is King
Although earnings are undoubtedly valuable for assessing company performance, we believe cash is king because you can’t use accounting profits to pay the bills.
Caleres has shown poor cash profitability over the last two years, giving the company limited opportunities to return capital to shareholders. Its free cash flow margin averaged 4.6%, lousy for a consumer discretionary business.
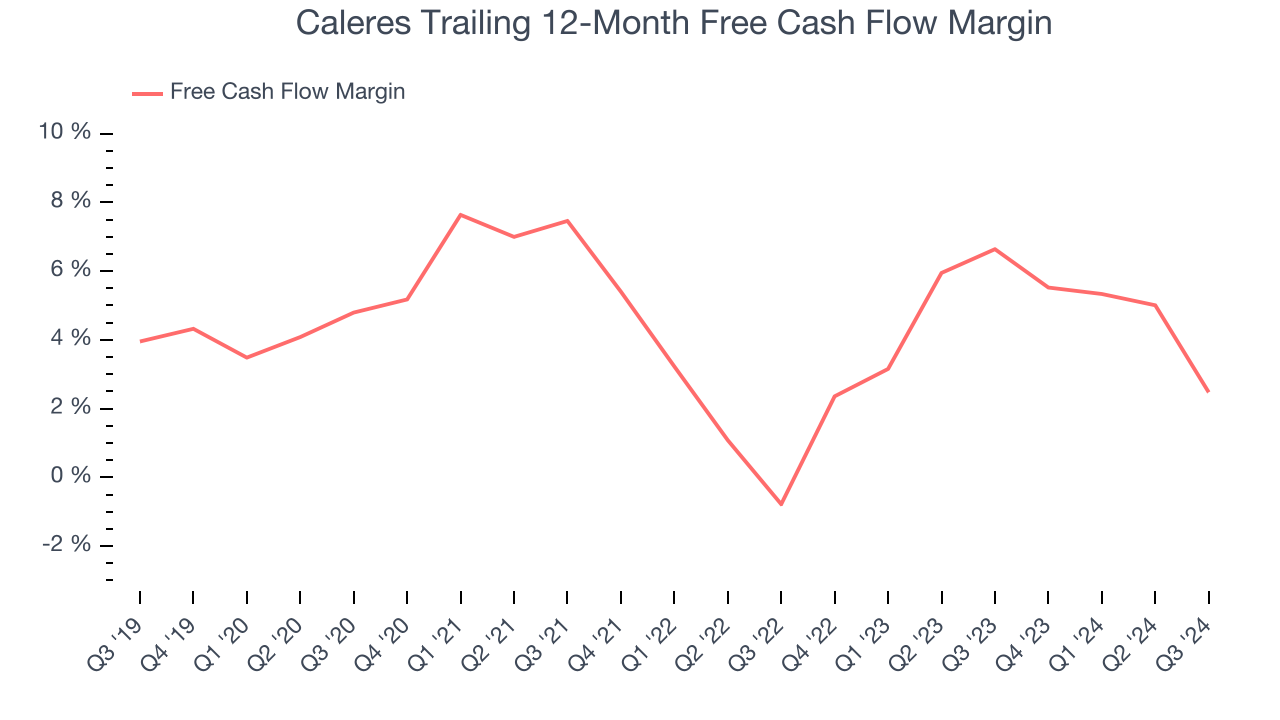
Caleres burned through $58.36 million of cash in Q3, equivalent to a negative 7.9% margin. The company’s cash flow turned negative after being positive in the same quarter last year, prompting us to pay closer attention. Short-term fluctuations typically aren’t a big deal because investment needs can be seasonal, but we’ll be watching to see if the trend extrapolates into future quarters.
Over the next year, analysts predict Caleres’s cash conversion will improve. Their consensus estimates imply its free cash flow margin of 2.5% for the last 12 months will increase to 7.5%, it options for capital deployment (investments, share buybacks, etc.).
Key Takeaways from Caleres’s Q3 Results
We struggled to find many resounding positives in these results as its revenue and EPS missed Wall Street's estimates. It also lowered its full-year EPS guidance. Overall, this quarter could have been better. The stock traded down 10.6% to $29.70 immediately after reporting.
The latest quarter from Caleres’s wasn’t that good. One earnings report doesn’t define a company’s quality, though, so let’s explore whether the stock is a buy at the current price. What happened in the latest quarter matters, but not as much as longer-term business quality and valuation, when deciding whether to invest in this stock. We cover that in our actionable full research report which you can read here, it’s free.