Over the past six months, Leggett & Platt’s shares (currently trading at $9.55) have posted a disappointing 15.1% loss, well below the S&P 500’s 4.7% gain. This was partly due to its softer quarterly results and may have investors wondering how to approach the situation.
Is now the time to buy Leggett & Platt, or should you be careful about including it in your portfolio? Check out our in-depth research report to see what our analysts have to say, it’s free.Even with the cheaper entry price, we're sitting this one out for now. Here are three reasons why there are better opportunities than LEG and a stock we'd rather own.
Why Do We Think Leggett & Platt Will Underperform?
Founded in 1883, Leggett & Platt (NYSE: LEG) is a diversified manufacturer of products and components for various industries.
1. Long-Term Revenue Growth Flatter Than a Pancake
Examining a company’s long-term performance can provide clues about its quality. Any business can put up a good quarter or two, but the best consistently grow over the long haul. Unfortunately, Leggett & Platt struggled to consistently increase demand as its $4.44 billion of sales for the trailing 12 months was close to its revenue five years ago. This was below our standards and signals it’s a low quality business. 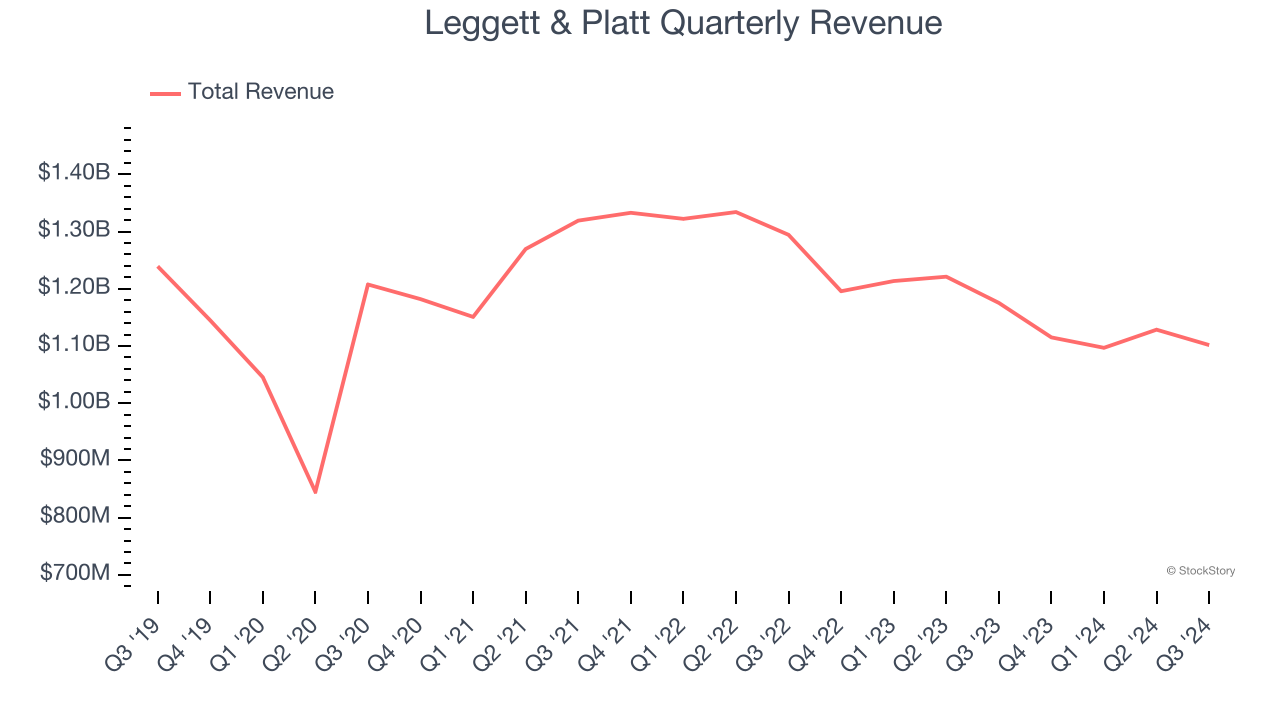
2. EPS Trending Down
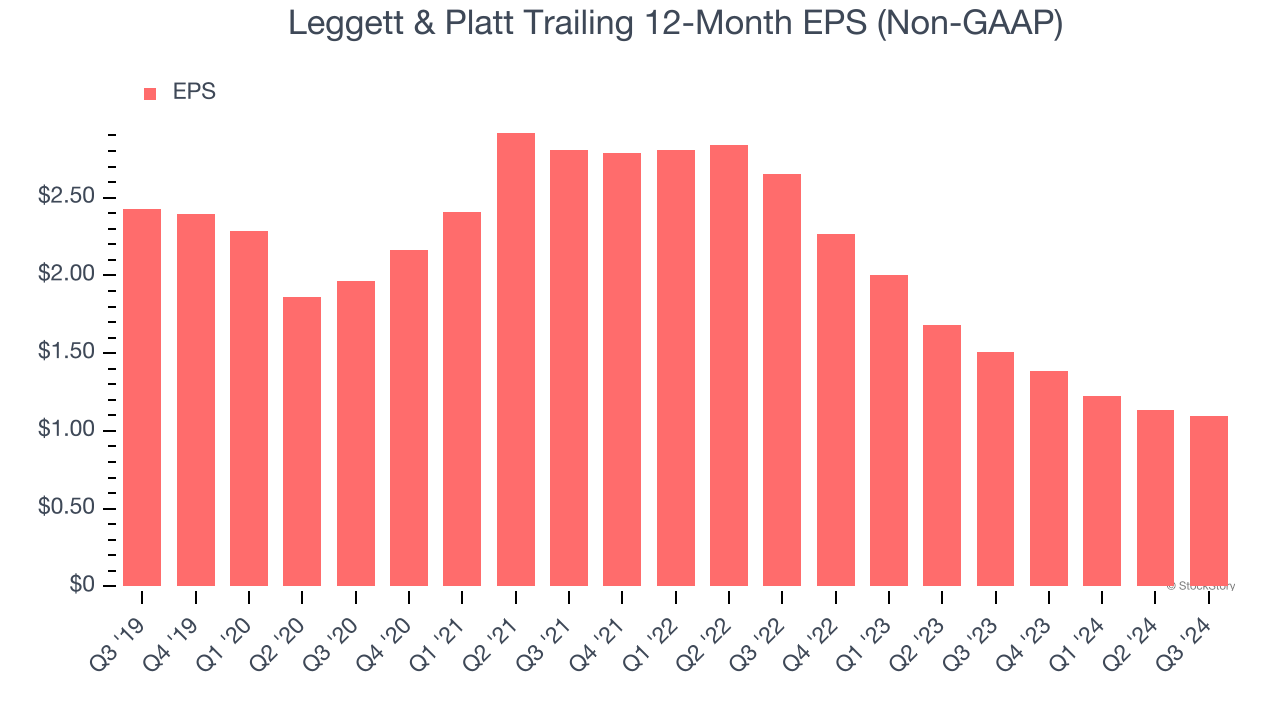
We track the long-term change in earnings per share (EPS) because it highlights whether a company’s growth is profitable.
Sadly for Leggett & Platt, its EPS declined by 14.7% annually over the last five years while its revenue was flat. This tells us the company struggled because its fixed cost base made it difficult to adjust to choppy demand.
3. New Investments Fail to Bear Fruit as ROIC Declines
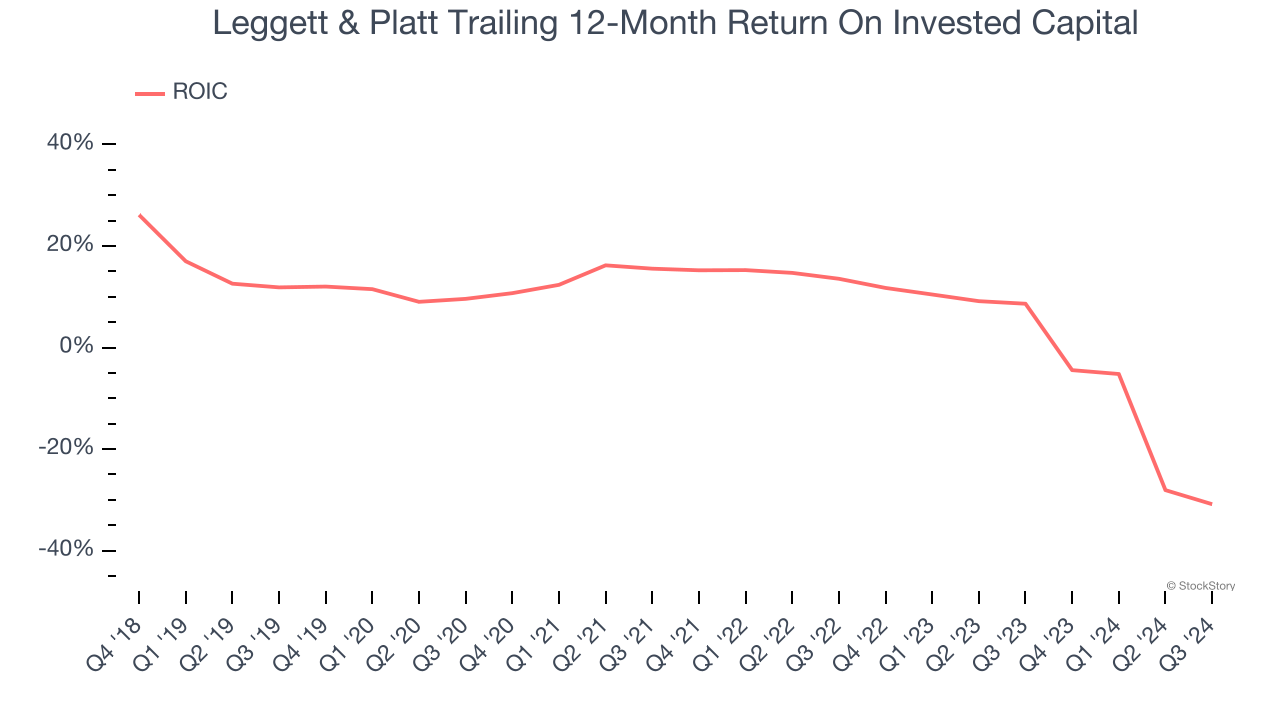
ROIC, or return on invested capital, is a metric showing how much operating profit a company generates relative to the money it has raised (debt and equity).
We typically prefer to invest in companies with high returns because it means they have viable business models, but the trend in a company’s ROIC is often what surprises the market and moves the stock price. Unfortunately, Leggett & Platt’s ROIC has decreased significantly over the last few years. Paired with its already low returns, these declines suggest its profitable growth opportunities are few and far between.
Final Judgment
We see the value of companies helping consumers, but in the case of Leggett & Platt, we’re out. After the recent drawdown, the stock trades at 7.9× forward price-to-earnings (or $9.55 per share). While this valuation is optically cheap, the potential downside is huge given its shaky fundamentals. There are better investments elsewhere. We’d recommend looking at Yum! Brands, an all-weather company that owns household favorite Taco Bell.
Stocks We Like More Than Leggett & Platt
The Trump trade may have passed, but rates are still dropping and inflation is still cooling. Opportunities are ripe for those ready to act - and we’re here to help you pick them.
Get started by checking out our Top 5 Growth Stocks for this month. This is a curated list of our High Quality stocks that have generated a market-beating return of 175% over the last five years.
Stocks that made our list in 2019 include now familiar names such as Nvidia (+2,691% between September 2019 and September 2024) as well as under-the-radar businesses like Comfort Systems (+783% five-year return). Find your next big winner with StockStory today for free.