The end of the earnings season is always a good time to take a step back and see who shined (and who not so much). Let’s take a look at how industrial packaging stocks fared in Q3, starting with Berry Global Group (NYSE: BERY).
Industrial packaging companies have built competitive advantages from economies of scale that lead to advantaged purchasing and capital investments that are difficult and expensive to replicate. Recently, eco-friendly packaging and conservation are driving customers preferences and innovation. For example, plastic is not as desirable a material as it once was. Despite being integral to consumer goods ranging from beer to toothpaste to laundry detergent, these companies are still at the whim of the macro, especially consumer health and consumer willingness to spend.
The 9 industrial packaging stocks we track reported a mixed Q3. As a group, revenues were in line with analysts’ consensus estimates.
Amidst this news, share prices of the companies have had a rough stretch. On average, they are down 6.7% since the latest earnings results.
Berry Global Group (NYSE: BERY)
Founded as Imperial Plastics, Berry Global (NYSE: BERY) is a manufacturer and marketer of plastic packaging products, including containers, bottles, and prescription packaging.
Berry Global Group reported revenues of $3.17 billion, up 2.6% year on year. This print exceeded analysts’ expectations by 1.1%. Despite the top-line beat, it was still a slower quarter for the company with full-year EPS guidance missing analysts’ expectations.
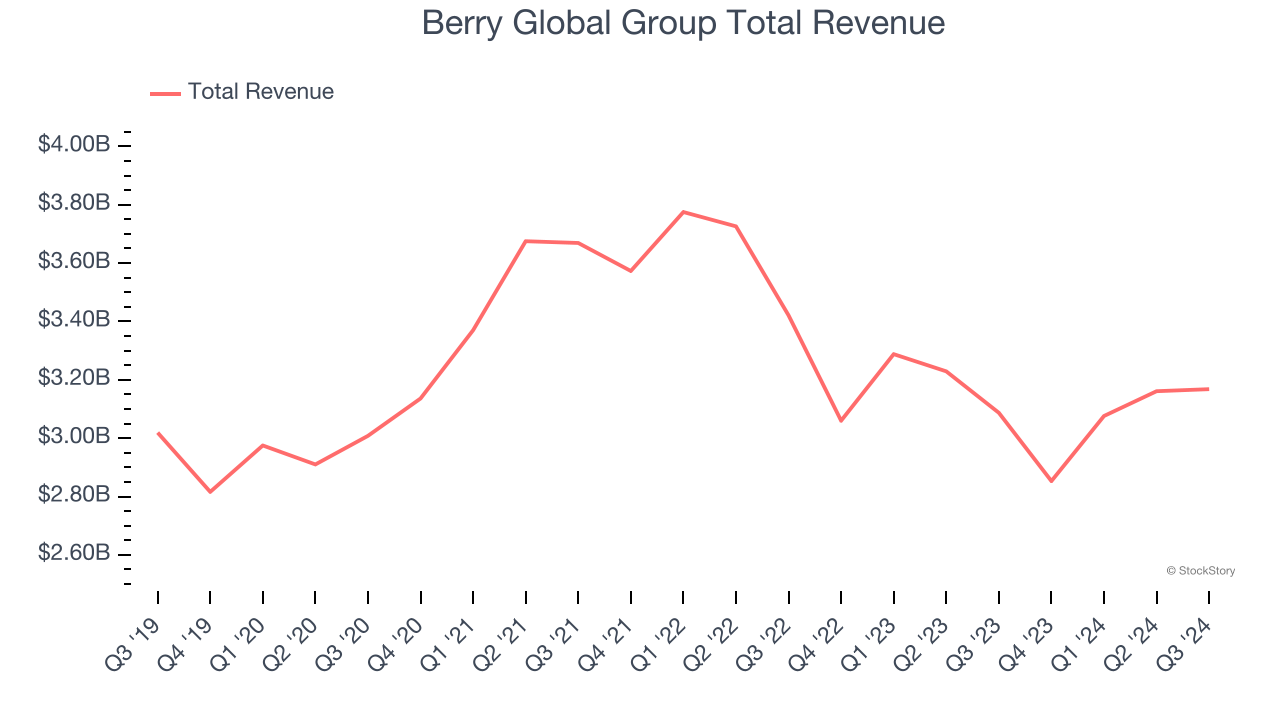
Unsurprisingly, the stock is down 2.5% since reporting and currently trades at $65.36.
Read our full report on Berry Global Group here, it’s free.
Best Q3: International Paper (NYSE: IP)
Established in 1898, International Paper (NYSE: IP) produces containerboard, pulp, paper, and materials used in packaging and printing applications.
International Paper reported revenues of $4.69 billion, up 1.6% year on year, in line with analysts’ expectations. The business had an exceptional quarter with an impressive beat of analysts’ EPS estimates and a solid beat of analysts’ EBITDA estimates.
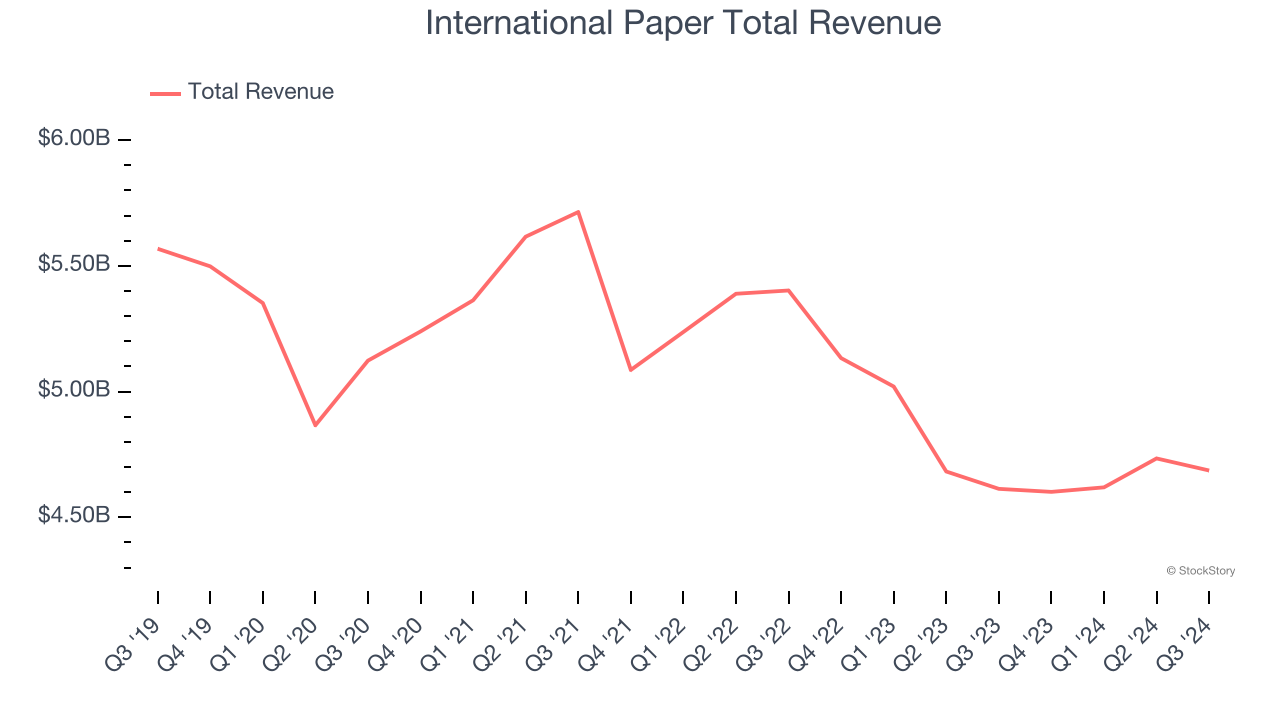
The market seems happy with the results as the stock is up 10.3% since reporting. It currently trades at $54.09.
Is now the time to buy International Paper? Access our full analysis of the earnings results here, it’s free.
Weakest Q3: Silgan Holdings (NYSE: SLGN)
Established in 1987, Silgan Holdings (NYSE: SLGN) is a supplier of rigid packaging for consumer goods products, specializing in metal containers, closures, and plastic packaging.
Silgan Holdings reported revenues of $1.75 billion, down 3.2% year on year, falling short of analysts’ expectations by 4.6%. It was a disappointing quarter as it posted a significant miss of analysts’ adjusted operating income estimates.
Silgan Holdings delivered the weakest performance against analyst estimates in the group. The stock is flat since the results and currently trades at $50.52.
Read our full analysis of Silgan Holdings’s results here.
Packaging Corporation of America (NYSE: PKG)
Founded in 1959, Packaging Corporation of America (NYSE: PKG) produces containerboard and corrugated packaging products, also offering displays and protective packaging solutions.
Packaging Corporation of America reported revenues of $2.18 billion, up 12.7% year on year. This result surpassed analysts’ expectations by 4.4%. Overall, it was an exceptional quarter as it also put up an impressive beat of analysts’ sales volume estimates.
Packaging Corporation of America pulled off the biggest analyst estimates beat and fastest revenue growth among its peers. The stock is up 5.3% since reporting and currently trades at $228.05.
Read our full, actionable report on Packaging Corporation of America here, it’s free.
Crown Holdings (NYSE: CCK)
Formerly Crown Cork & Seal, Crown Holdings (NYSE: CCK) produces packaging products for consumer marketing companies, including food, beverage, household, and industrial products.
Crown Holdings reported revenues of $3.07 billion, flat year on year. This number met analysts’ expectations. It was a strong quarter as it also recorded a solid beat of analysts’ adjusted operating income estimates and full-year EPS guidance exceeding analysts’ expectations.
The stock is down 16.1% since reporting and currently trades at $78.77.
Read our full, actionable report on Crown Holdings here, it’s free.
Market Update
Thanks to the Fed's series of rate hikes in 2022 and 2023, inflation has cooled significantly from its post-pandemic highs, drawing closer to the 2% goal. This disinflation has occurred without severely impacting economic growth, suggesting the success of a soft landing. The stock market has thrived in 2024, spurred by recent rate cuts (0.5% in September and 0.25% each in November and December), and a notable surge followed Donald Trump's presidential election win in November, propelling indices to historic highs. Nonetheless, the outlook for 2025 remains clouded by the pace and magnitude of future rate cuts as well as potential changes in trade policy and corporate taxes once the Trump administration takes over. The path forward is marked by uncertainty.
Want to invest in winners with rock-solid fundamentals? Check out our 9 Best Market-Beating Stocks and add them to your watchlist. These companies are poised for growth regardless of the political or macroeconomic climate.
Join Paid Stock Investor Research
Help us make StockStory more helpful to investors like yourself. Join our paid user research session and receive a $50 Amazon gift card for your opinions. Sign up here.