Looking back on leisure facilities stocks’ Q3 earnings, we examine this quarter’s best and worst performers, including Topgolf Callaway (NYSE: MODG) and its peers.
Leisure facilities companies often sell experiences rather than tangible products, and in the last decade-plus, consumers have slowly shifted their spending from "things" to "experiences". Leisure facilities seek to benefit but must innovate to do so because of the industry's high competition and capital intensity.
The 12 leisure facilities stocks we track reported a satisfactory Q3. As a group, revenues beat analysts’ consensus estimates by 1.7% while next quarter’s revenue guidance was 4.5% below.
While some leisure facilities stocks have fared somewhat better than others, they have collectively declined. On average, share prices are down 3.2% since the latest earnings results.
Topgolf Callaway (NYSE: MODG)
Formed between the merger of Callaway and Topgolf, Topgolf Callaway (NYSE: MODG) sells golf equipment and operates technology-driven golf entertainment venues.
Topgolf Callaway reported revenues of $1.01 billion, down 2.7% year on year. This print exceeded analysts’ expectations by 3.2%. Overall, it was a satisfactory quarter for the company with an impressive beat of analysts’ EPS estimates but EBITDA guidance for next quarter missing analysts’ expectations significantly.
"We are pleased to announce results that exceeded our expectations for Q3 amid a challenging macroeconomic backdrop," commented Chip Brewer, President and Chief Executive Officer of Topgolf Callaway Brands.
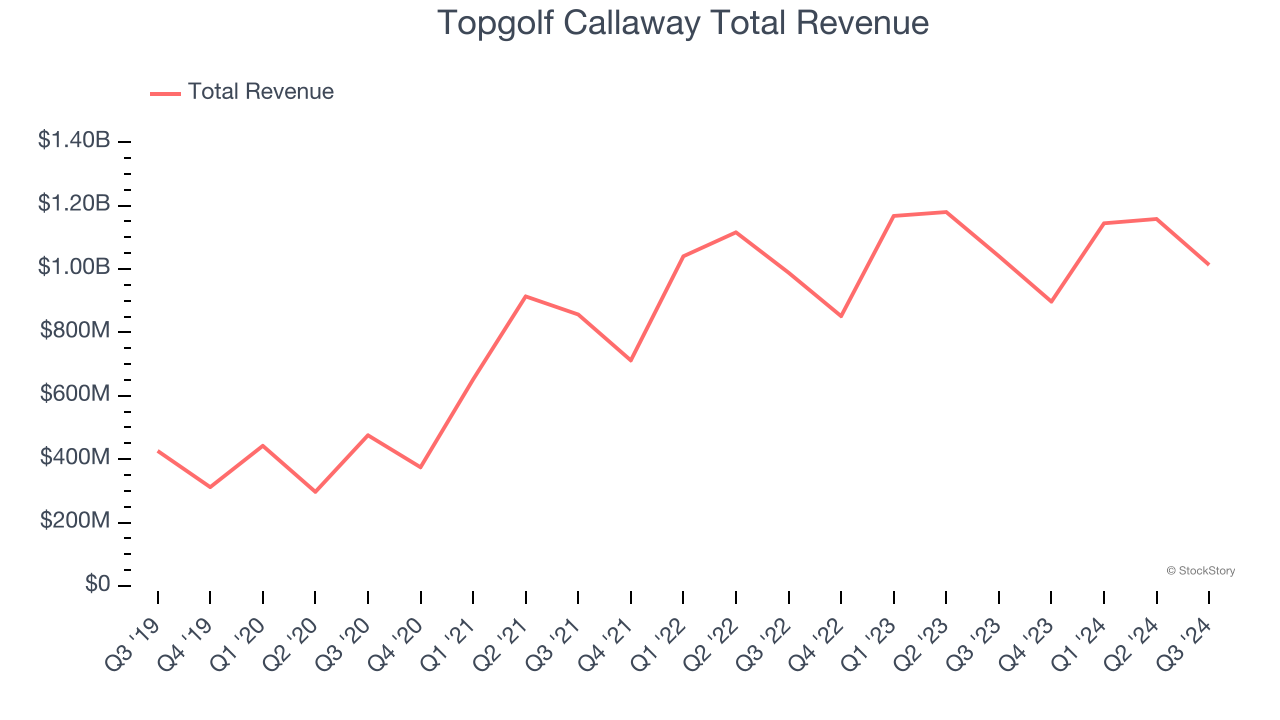
Unsurprisingly, the stock is down 10% since reporting and currently trades at $8.50.
Is now the time to buy Topgolf Callaway? Access our full analysis of the earnings results here, it’s free.
Best Q3: Live Nation (NYSE: LYV)
Owner of Ticketmaster and operator of music festival EDC, Live Nation (NYSE: LYV) is a company specializing in live event promotion, venue management, and ticketing services for concerts and shows.
Live Nation reported revenues of $7.65 billion, down 6.2% year on year, falling short of analysts’ expectations by 2.2%. However, the business still had a very strong quarter with a solid beat of analysts’ adjusted operating income estimates.
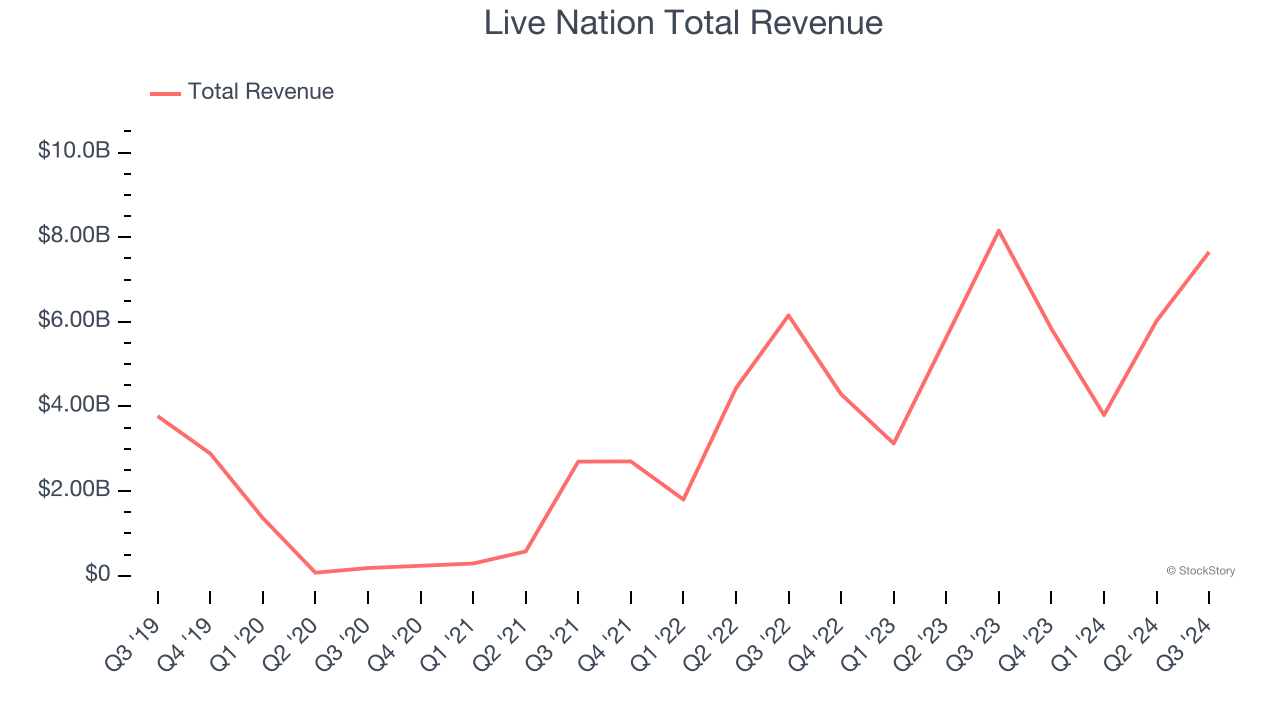
The market seems content with the results as the stock is up 3.7% since reporting. It currently trades at $128.51.
Is now the time to buy Live Nation? Access our full analysis of the earnings results here, it’s free.
Weakest Q3: Dave & Buster's (NASDAQ: PLAY)
Founded by a former game parlor and bar operator, Dave & Buster’s (NASDAQ: PLAY) operates a chain of arcades providing immersive entertainment experiences.
Dave & Buster's reported revenues of $453 million, down 3% year on year, falling short of analysts’ expectations by 2.3%. It was a softer quarter as it posted a significant miss of analysts’ EPS estimates and a miss of analysts’ adjusted operating income estimates.
Dave & Buster's delivered the weakest performance against analyst estimates in the group. As expected, the stock is down 24.2% since the results and currently trades at $27.91.
Read our full analysis of Dave & Buster’s results here.
European Wax Center (NASDAQ: EWCZ)
Founded by two siblings, European Wax Center (NASDAQ: EWCZ) is a beauty and waxing salon chain specializing in professional wax services and skincare products.
European Wax Center reported revenues of $55.43 million, flat year on year. This print topped analysts’ expectations by 2.3%. It was a strong quarter as it also produced a solid beat of analysts’ EPS estimates and an impressive beat of analysts’ adjusted operating income estimates.
The stock is down 20.1% since reporting and currently trades at $6.41.
Read our full, actionable report on European Wax Center here, it’s free.
Life Time (NYSE: LTH)
With over 150 locations and gyms that include saunas and steam rooms, Life Time (NYSE: LTH) is an upscale fitness club emphasizing holistic well-being and fitness.
Life Time reported revenues of $693.2 million, up 18.5% year on year. This number was in line with analysts’ expectations. It was a satisfactory quarter as it also logged a decent beat of analysts’ EPS estimates.
The stock is down 6.7% since reporting and currently trades at $23.61.
Read our full, actionable report on Life Time here, it’s free.
Market Update
Thanks to the Fed's series of rate hikes in 2022 and 2023, inflation has cooled significantly from its post-pandemic highs, drawing closer to the 2% goal. This disinflation has occurred without severely impacting economic growth, suggesting the success of a soft landing. The stock market has thrived in 2024, spurred by recent rate cuts (0.5% in September and 0.25% each in November and December), and a notable surge followed Donald Trump's presidential election win in November, propelling indices to historic highs. Nonetheless, the outlook for 2025 remains clouded by the pace and magnitude of future rate cuts as well as potential changes in trade policy and corporate taxes once the Trump administration takes over. The path forward is marked by uncertainty.
Want to invest in winners with rock-solid fundamentals? Check out our Top 5 Growth Stocks and add them to your watchlist. These companies are poised for growth regardless of the political or macroeconomic climate.
Join Paid Stock Investor Research
Help us make StockStory more helpful to investors like yourself. Join our paid user research session and receive a $50 Amazon gift card for your opinions. Sign up here.