As the Q3 earnings season wraps, let’s dig into this quarter’s best and worst performers in the general industrial machinery industry, including John Bean (NYSE: JBT) and its peers.
Automation that increases efficiency and connected equipment that collects analyzable data have been trending, creating new demand for general industrial machinery companies. Those who innovate and create digitized solutions can spur sales and speed up replacement cycles, but all general industrial machinery companies are still at the whim of economic cycles. Consumer spending and interest rates, for example, can greatly impact the industrial production that drives demand for these companies’ offerings.
The 15 general industrial machinery stocks we track reported a mixed Q3. As a group, revenues were in line with analysts’ consensus estimates while next quarter’s revenue guidance was 5.5% below.
In light of this news, share prices of the companies have held steady as they are up 2.1% on average since the latest earnings results.
John Bean (NYSE: JBT)
Tracing back to its invention of the mechanical milk bottle filler in 1884, John Bean (NYSE: JBT) designs, manufactures, and sells equipment used for food processing and aviation.
John Bean reported revenues of $453.8 million, up 12.4% year on year. This print exceeded analysts’ expectations by 2.6%. Overall, it was a satisfactory quarter for the company with a decent beat of analysts’ EPS estimates but full-year EBITDA guidance slightly missing analysts’ expectations.
"We are pleased with our third quarter execution, which enabled record quarterly revenue, adjusted EBITDA, and adjusted EPS from continuing operations," said Brian Deck, President and Chief Executive Officer.
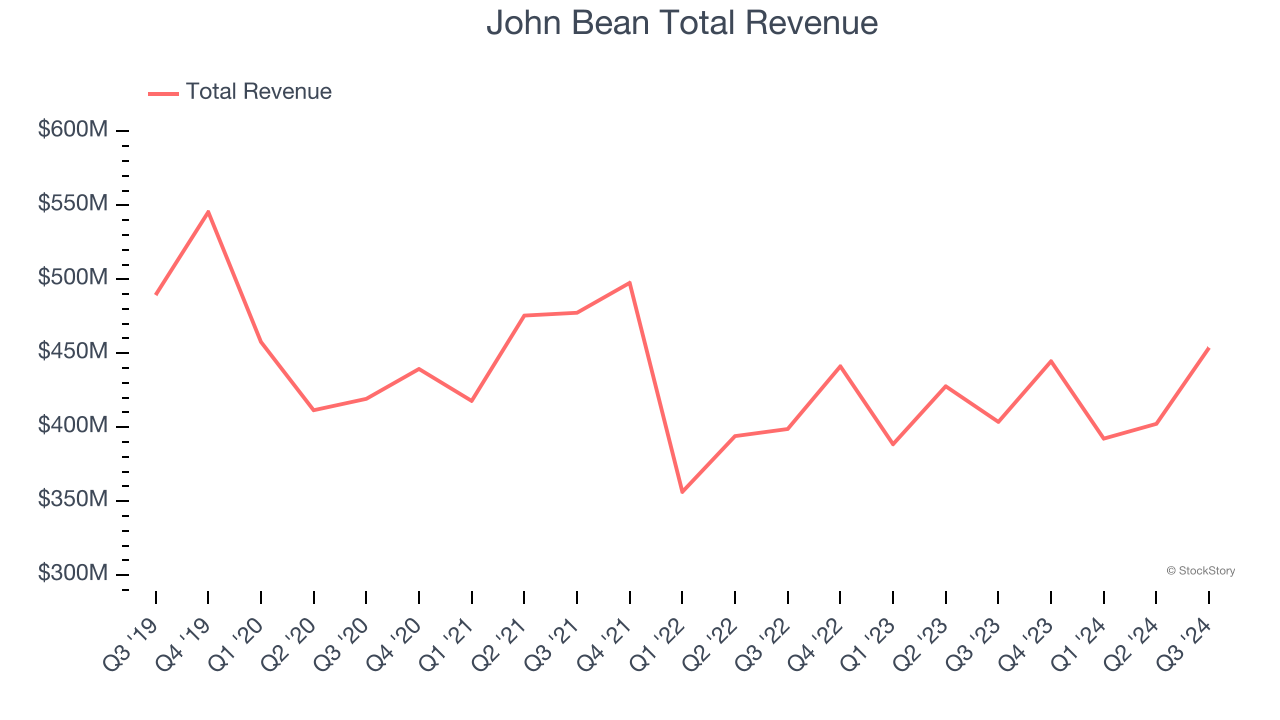
John Bean scored the fastest revenue growth and highest full-year guidance raise of the whole group. Unsurprisingly, the stock is up 31.6% since reporting and currently trades at $125.32.
Is now the time to buy John Bean? Access our full analysis of the earnings results here, it’s free.
Best Q3: Luxfer (NYSE: LXFR)
With its magnesium alloys used in the construction of the famous Spirit of St. Louis aircraft, Luxfer (NYSE: LXFR) offers specialized materials, components, and gas containment devices to various industries.
Luxfer reported revenues of $99.4 million, up 2.1% year on year, outperforming analysts’ expectations by 15.9%. The business had an incredible quarter with a solid beat of analysts’ EPS estimates and an impressive beat of analysts’ EBITDA estimates.
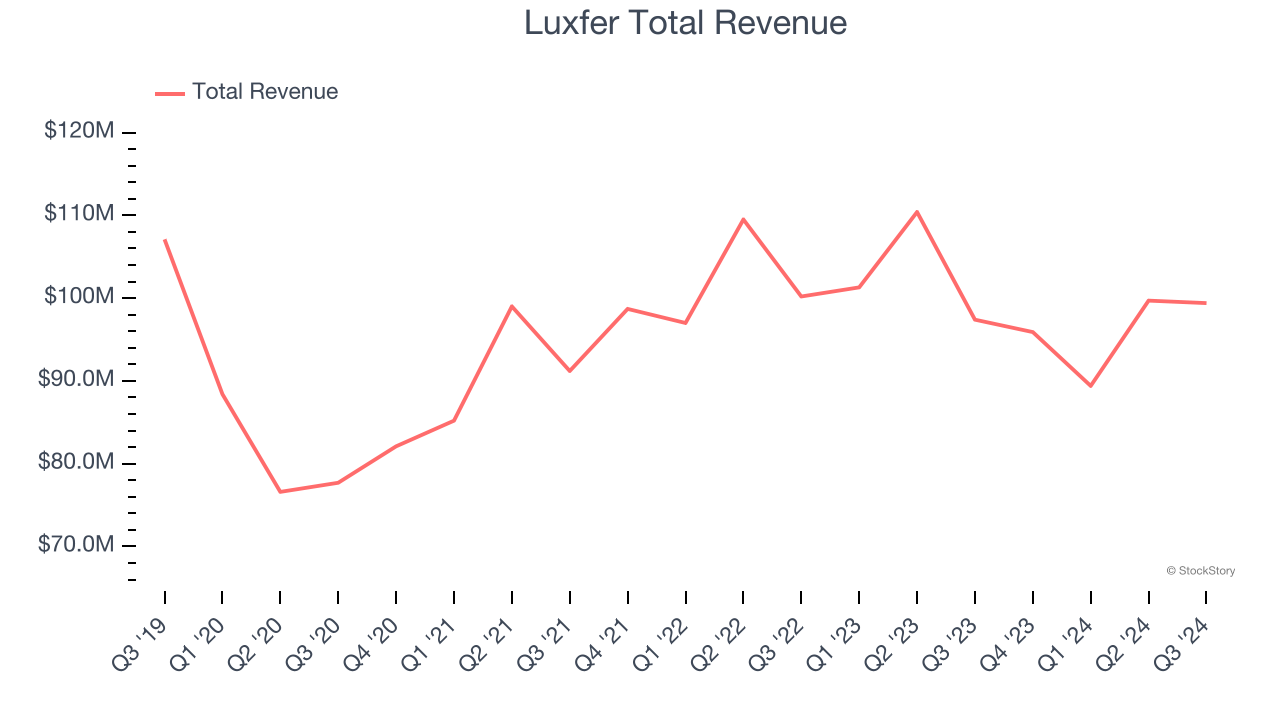
Luxfer scored the biggest analyst estimates beat among its peers. Although it had a fine quarter compared to its peers, the market seems unhappy with the results as the stock is down 1.8% since reporting. It currently trades at $12.52.
Is now the time to buy Luxfer? Access our full analysis of the earnings results here, it’s free.
Weakest Q3: Icahn Enterprises (NASDAQ: IEP)
Founded in 1987, Icahn Enterprises (NASDAQ: IEP) is a diversified holding company primarily engaged in investment and asset management across various sectors.
Icahn Enterprises reported revenues of $2.22 billion, down 25.7% year on year, falling short of analysts’ expectations by 4.1%. It was a disappointing quarter as it posted a significant miss of analysts’ EPS estimates.
Icahn Enterprises delivered the slowest revenue growth in the group. As expected, the stock is down 28.6% since the results and currently trades at $9.20.
Read our full analysis of Icahn Enterprises’s results here.
L.B. Foster (NASDAQ: FSTR)
Founded with a $2,500 loan, L.B. Foster (NASDAQ: FSTR) is a provider of products and services for the transportation and energy infrastructure sectors, including rail products, construction materials, and coating solutions.
L.B. Foster reported revenues of $137.5 million, down 5.4% year on year. This print lagged analysts' expectations by 3.4%. Zooming out, it was actually a strong quarter as it produced a solid beat of analysts’ EPS and EBITDA estimates.
The stock is up 20.5% since reporting and currently trades at $25.50.
Read our full, actionable report on L.B. Foster here, it’s free.
Dover (NYSE: DOV)
A company that manufactured critical equipment for the United States military during World War II, Dover (NYSE: DOV) manufactures engineered components and specialized equipment for numerous industries.
Dover reported revenues of $1.98 billion, up 1.3% year on year. This print missed analysts’ expectations by 1%. Overall, it was a slower quarter as it also recorded a miss of analysts’ organic revenue and EBITDA estimates.
The stock is down 2.5% since reporting and currently trades at $186.75.
Read our full, actionable report on Dover here, it’s free.
Market Update
Thanks to the Fed's series of rate hikes in 2022 and 2023, inflation has cooled significantly from its post-pandemic highs, drawing closer to the 2% goal. This disinflation has occurred without severely impacting economic growth, suggesting the success of a soft landing. The stock market has thrived in 2024, spurred by recent rate cuts (0.5% in September and 0.25% each in November and December), and a notable surge followed Donald Trump's presidential election win in November, propelling indices to historic highs. Nonetheless, the outlook for 2025 remains clouded by the pace and magnitude of future rate cuts as well as potential changes in trade policy and corporate taxes once the Trump administration takes over. The path forward is marked by uncertainty.
Want to invest in winners with rock-solid fundamentals? Check out our 9 Best Market-Beating Stocks and add them to your watchlist. These companies are poised for growth regardless of the political or macroeconomic climate.
Join Paid Stock Investor Research
Help us make StockStory more helpful to investors like yourself. Join our paid user research session and receive a $50 Amazon gift card for your opinions. Sign up here.