
Looking back on industrial packaging stocks’ Q3 earnings, we examine this quarter’s best and worst performers, including Packaging Corporation of America (NYSE: PKG) and its peers.
Industrial packaging companies have built competitive advantages from economies of scale that lead to advantaged purchasing and capital investments that are difficult and expensive to replicate. Recently, eco-friendly packaging and conservation are driving customers preferences and innovation. For example, plastic is not as desirable a material as it once was. Despite being integral to consumer goods ranging from beer to toothpaste to laundry detergent, these companies are still at the whim of the macro, especially consumer health and consumer willingness to spend.
The 9 industrial packaging stocks we track reported a mixed Q3. As a group, revenues were in line with analysts’ consensus estimates.
While some industrial packaging stocks have fared somewhat better than others, they have collectively declined. On average, share prices are down 3.9% since the latest earnings results.
Packaging Corporation of America (NYSE: PKG)
Founded in 1959, Packaging Corporation of America (NYSE: PKG) produces containerboard and corrugated packaging products, also offering displays and protective packaging solutions.
Packaging Corporation of America reported revenues of $2.18 billion, up 12.7% year on year. This print exceeded analysts’ expectations by 4.4%. Overall, it was an exceptional quarter for the company with a solid beat of analysts’ sales volume and adjusted operating income estimates.
Commenting on reported results, Mark W. Kowlzan, Chairman and CEO, said, “In the Packaging segment, we had great implementation of our previously announced containerboard and corrugated products price increases. Very strong demand throughout the quarter led to all-time quarterly records for containerboard production, total box shipments and shipments per day. We were able to meet this demand, and our customers’ quality and service needs, through the operational benefits of our capital spending program and the continued great focus and execution by our sales, customer service, mill and corrugated products plant employees. Our Paper segment had excellent results with our previously announced price increases implemented as planned, volume above forecasted levels, and well-managed mill operations. Fortunately, none of our facilities were significantly impacted by the two hurricanes during the quarter.”
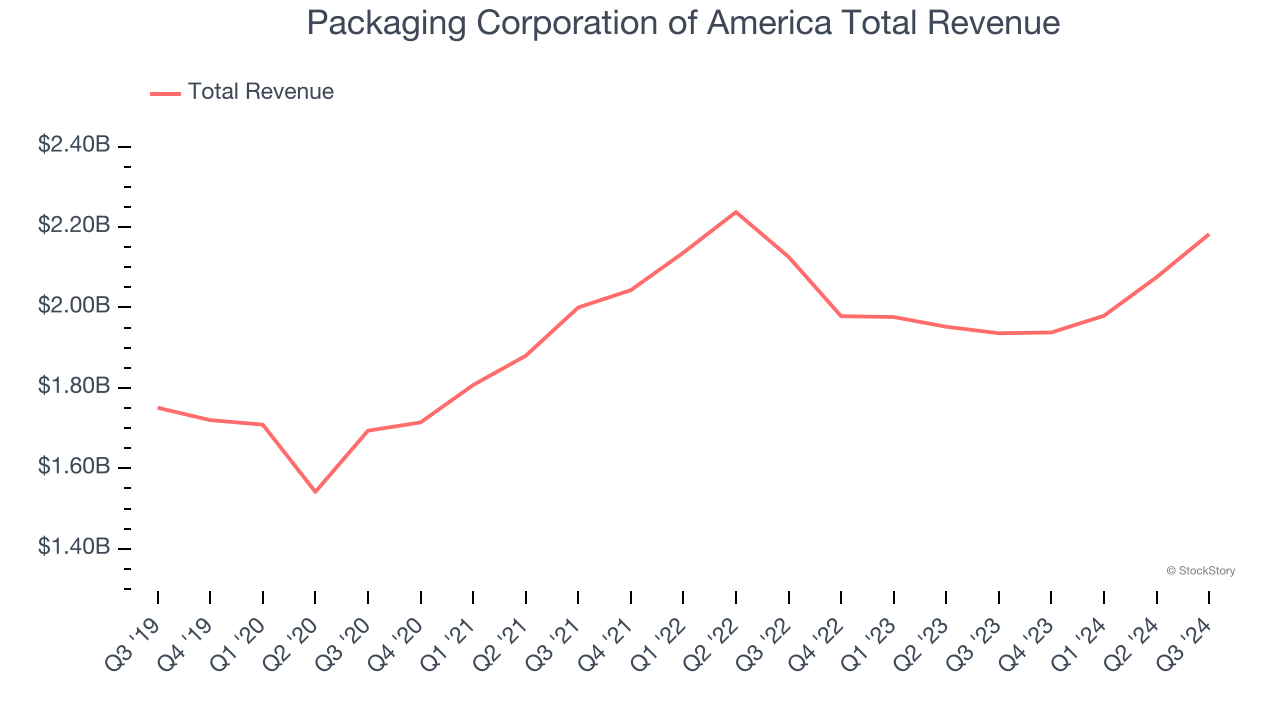
Packaging Corporation of America pulled off the biggest analyst estimates beat and fastest revenue growth of the whole group. Unsurprisingly, the stock is up 7.4% since reporting and currently trades at $232.66.
Is now the time to buy Packaging Corporation of America? Access our full analysis of the earnings results here, it’s free.
Best Q3: International Paper (NYSE: IP)
Established in 1898, International Paper (NYSE: IP) produces containerboard, pulp, paper, and materials used in packaging and printing applications.
International Paper reported revenues of $4.69 billion, up 1.6% year on year, in line with analysts’ expectations. The business had an exceptional quarter with an impressive beat of analysts’ EPS estimates and a solid beat of analysts’ EBITDA estimates.
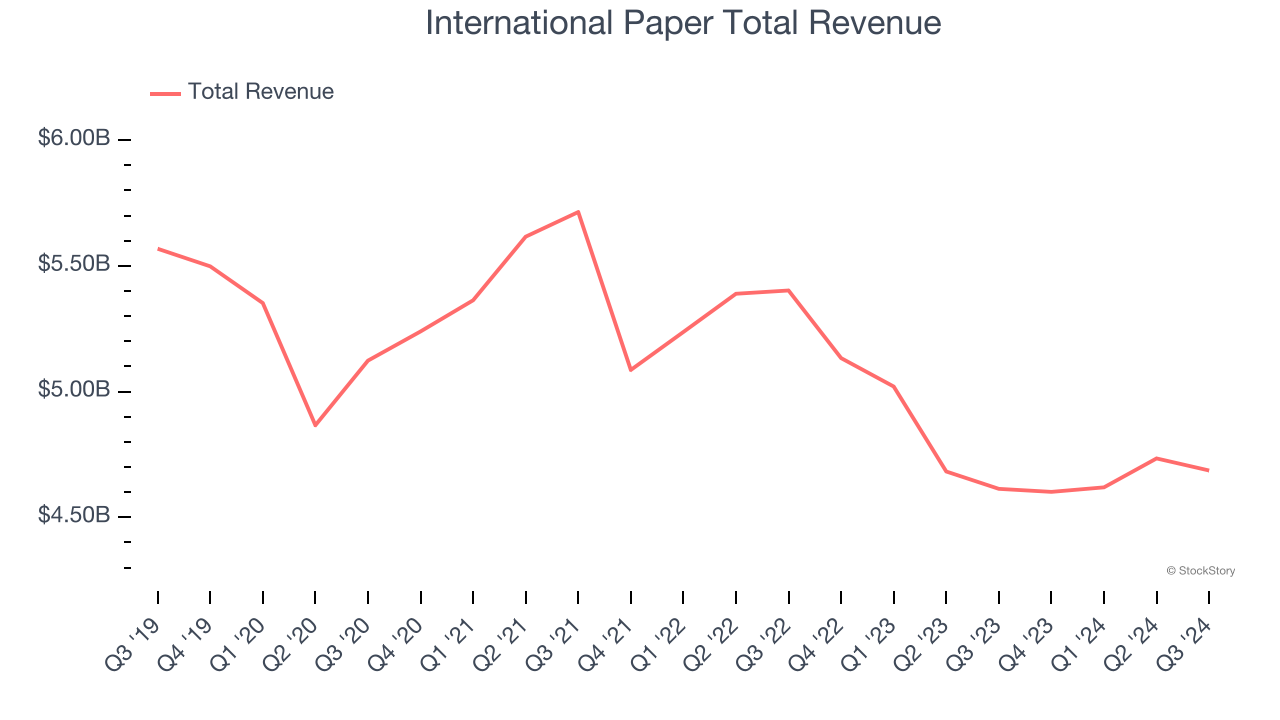
The market seems happy with the results as the stock is up 13% since reporting. It currently trades at $55.42.
Is now the time to buy International Paper? Access our full analysis of the earnings results here, it’s free.
Weakest Q3: Silgan Holdings (NYSE: SLGN)
Established in 1987, Silgan Holdings (NYSE: SLGN) is a supplier of rigid packaging for consumer goods products, specializing in metal containers, closures, and plastic packaging.
Silgan Holdings reported revenues of $1.75 billion, down 3.2% year on year, falling short of analysts’ expectations by 4.6%. It was a disappointing quarter as it posted a significant miss of analysts’ adjusted operating income estimates.
Silgan Holdings delivered the weakest performance against analyst estimates in the group. Interestingly, the stock is up 2.1% since the results and currently trades at $51.90.
Read our full analysis of Silgan Holdings’s results here.
Ball (NYSE: BALL)
Started with a $200 loan in 1880, Ball (NYSE: BLL) manufactures aluminum packaging for beverages, personal care, and household products as well as aerospace systems and other technologies.
Ball reported revenues of $3.08 billion, down 13.7% year on year. This number missed analysts’ expectations by 1.6%. It was a slower quarter as it also logged a miss of analysts’ organic revenue estimates.
Ball had the slowest revenue growth among its peers. The stock is down 15.4% since reporting and currently trades at $54.30.
Read our full, actionable report on Ball here, it’s free.
Graphic Packaging Holding (NYSE: GPK)
Founded in 1991, Graphic Packaging (NYSE: GPK) is a provider of paper-based packaging solutions for a wide range of products.
Graphic Packaging Holding reported revenues of $2.22 billion, down 5.7% year on year. This print lagged analysts' expectations by 2.8%. It was a softer quarter as it also produced a significant miss of analysts’ EPS estimates.
The stock is down 10.5% since reporting and currently trades at $27.17.
Read our full, actionable report on Graphic Packaging Holding here, it’s free.
Market Update
Thanks to the Fed's series of rate hikes in 2022 and 2023, inflation has cooled significantly from its post-pandemic highs, drawing closer to the 2% goal. This disinflation has occurred without severely impacting economic growth, suggesting the success of a soft landing. The stock market has thrived in 2024, spurred by recent rate cuts (0.5% in September and 0.25% each in November and December), and a notable surge followed Donald Trump's presidential election win in November, propelling indices to historic highs. Nonetheless, the outlook for 2025 remains clouded by the pace and magnitude of future rate cuts as well as potential changes in trade policy and corporate taxes once the Trump administration takes over. The path forward is marked by uncertainty.
Want to invest in winners with rock-solid fundamentals? Check out our 9 Best Market-Beating Stocks and add them to your watchlist. These companies are poised for growth regardless of the political or macroeconomic climate.
Join Paid Stock Investor Research
Help us make StockStory more helpful to investors like yourself. Join our paid user research session and receive a $50 Amazon gift card for your opinions. Sign up here.


