Since July 2024, Warner Music Group has been in a holding pattern, posting a small loss of 4.4% while floating around $30.31. The stock also fell short of the S&P 500’s 6.6% gain during that period.
Is now the time to buy Warner Music Group, or should you be careful about including it in your portfolio? Get the full breakdown from our expert analysts, it’s free.
We're cautious about Warner Music Group. Here are three reasons why there are better opportunities than WMG and a stock we'd rather own.
Why Is Warner Music Group Not Exciting?
Launching the careers of legendary artists like Frank Sinatra, Warner Music Group (NASDAQ: WMG) is a music company managing a diverse portfolio of artists, recordings, and music publishing services worldwide.
1. Long-Term Revenue Growth Disappoints
A company’s long-term performance is an indicator of its overall quality. While any business can experience short-term success, top-performing ones enjoy sustained growth for years. Unfortunately, Warner Music Group’s 7.5% annualized revenue growth over the last five years was sluggish. This fell short of our benchmark for the consumer discretionary sector. 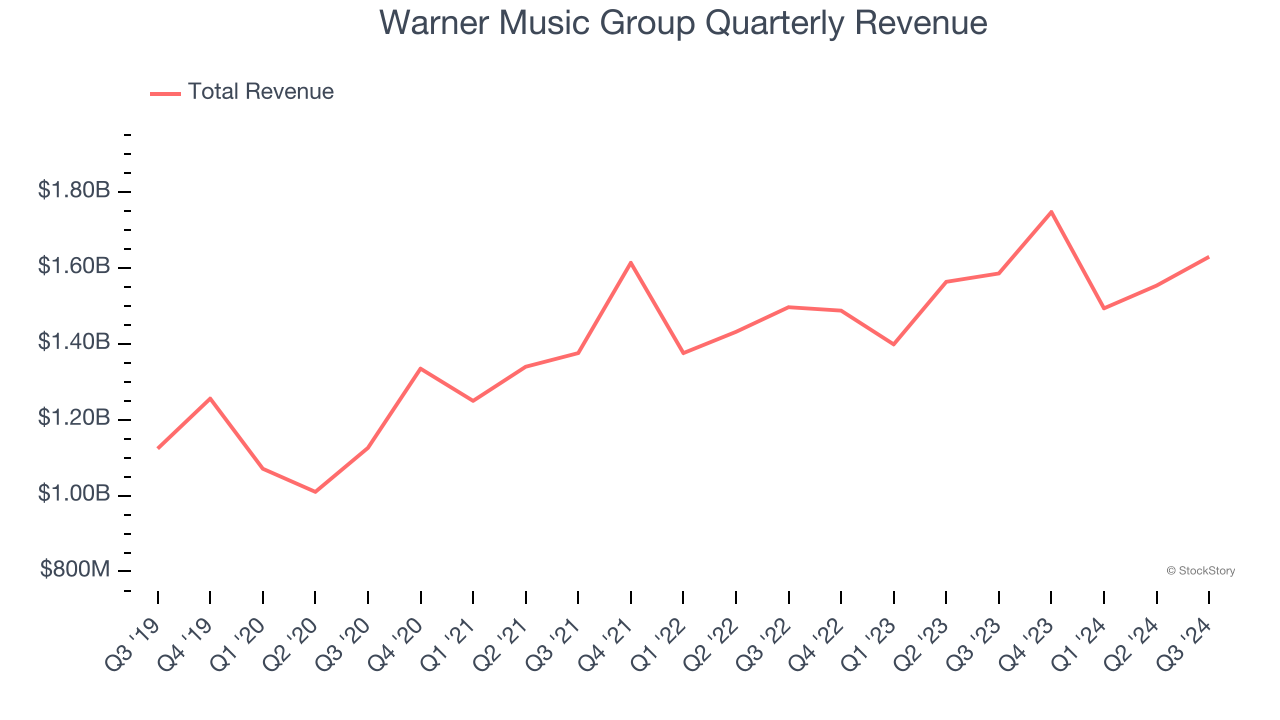
2. Projected Revenue Growth Is Slim
Forecasted revenues by Wall Street analysts signal a company’s potential. Predictions may not always be accurate, but accelerating growth typically boosts valuation multiples and stock prices while slowing growth does the opposite.
Over the next 12 months, sell-side analysts expect Warner Music Group’s revenue to rise by 4.8%, close to its 4.2% annualized growth for the past two years. This projection is underwhelming and suggests its newer products and services will not lead to better top-line performance yet.
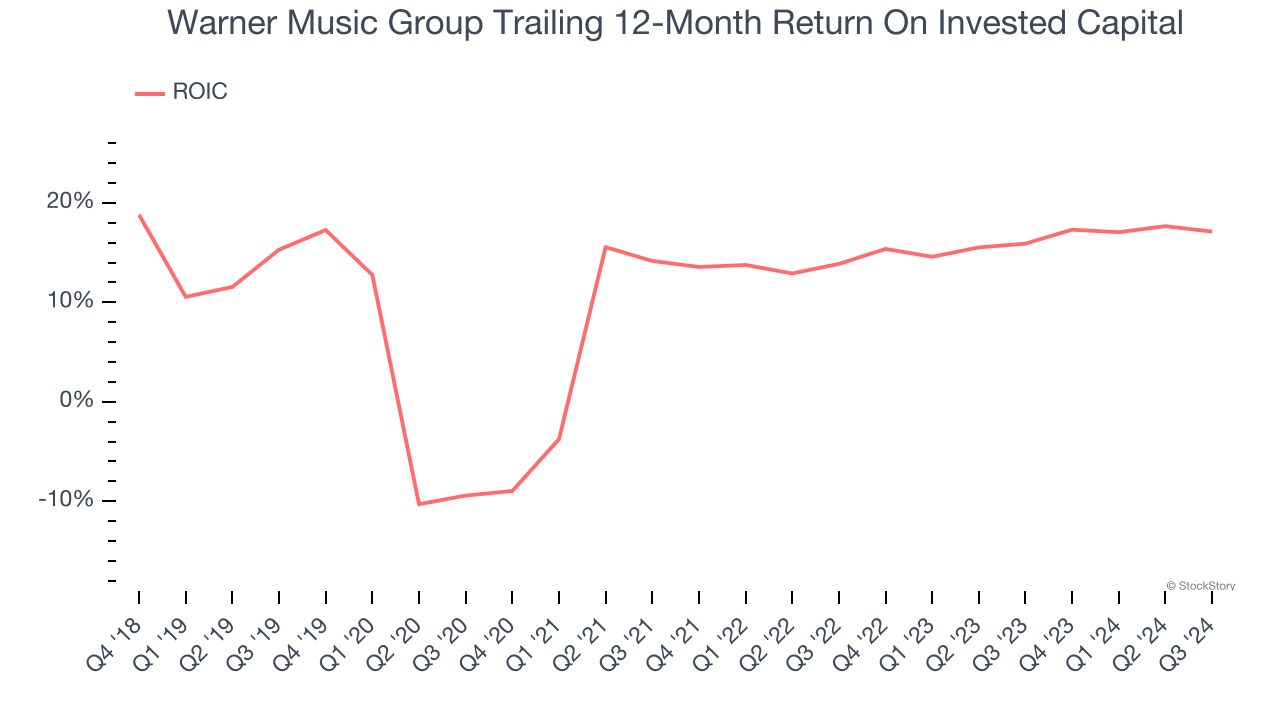
3. Previous Growth Initiatives Haven’t Paid Off Yet
Growth gives us insight into a company’s long-term potential, but how capital-efficient was that growth? A company’s ROIC explains this by showing how much operating profit it makes compared to the money it has raised (debt and equity).
Warner Music Group historically did a mediocre job investing in profitable growth initiatives. Its five-year average ROIC was 10.3%, somewhat low compared to the best consumer discretionary companies that consistently pump out 25%+.
Final Judgment
Warner Music Group isn’t a terrible business, but it doesn’t pass our quality test. With its shares lagging the market recently, the stock trades at 19.9× forward price-to-earnings (or $30.31 per share). Beauty is in the eye of the beholder, but we don’t really see a big opportunity at the moment. We're fairly confident there are better stocks to buy right now. We’d suggest looking at Meta, a top digital advertising platform riding the creator economy.
Stocks We Would Buy Instead of Warner Music Group
The Trump trade may have passed, but rates are still dropping and inflation is still cooling. Opportunities are ripe for those ready to act - and we’re here to help you pick them.
Get started by checking out our Top 5 Strong Momentum Stocks for this week. This is a curated list of our High Quality stocks that have generated a market-beating return of 175% over the last five years.
Stocks that made our list in 2019 include now familiar names such as Nvidia (+2,183% between December 2019 and December 2024) as well as under-the-radar businesses like Sterling Infrastructure (+1,096% five-year return). Find your next big winner with StockStory today for free.