Since July 2024, Mayville Engineering has been in a holding pattern, posting a small loss of 2.7% while floating around $15.72. The stock also fell short of the S&P 500’s 7.3% gain during that period.
Is there a buying opportunity in Mayville Engineering, or does it present a risk to your portfolio? Get the full stock story straight from our expert analysts, it’s free.We're sitting this one out for now. Here are three reasons why MEC doesn't excite us and a stock we'd rather own.
Why Is Mayville Engineering Not Exciting?
Originally founded solely on tool and die manufacturing, Mayville Engineering Company (NYSE: MEC) specializes in metal fabrication, tube bending, and welding to be used in various industries.
1. Long-Term Revenue Growth Disappoints
A company’s long-term performance is an indicator of its overall quality. While any business can experience short-term success, top-performing ones enjoy sustained growth for years. Unfortunately, Mayville Engineering’s 3.7% annualized revenue growth over the last five years was sluggish. This fell short of our benchmark for the industrials sector. 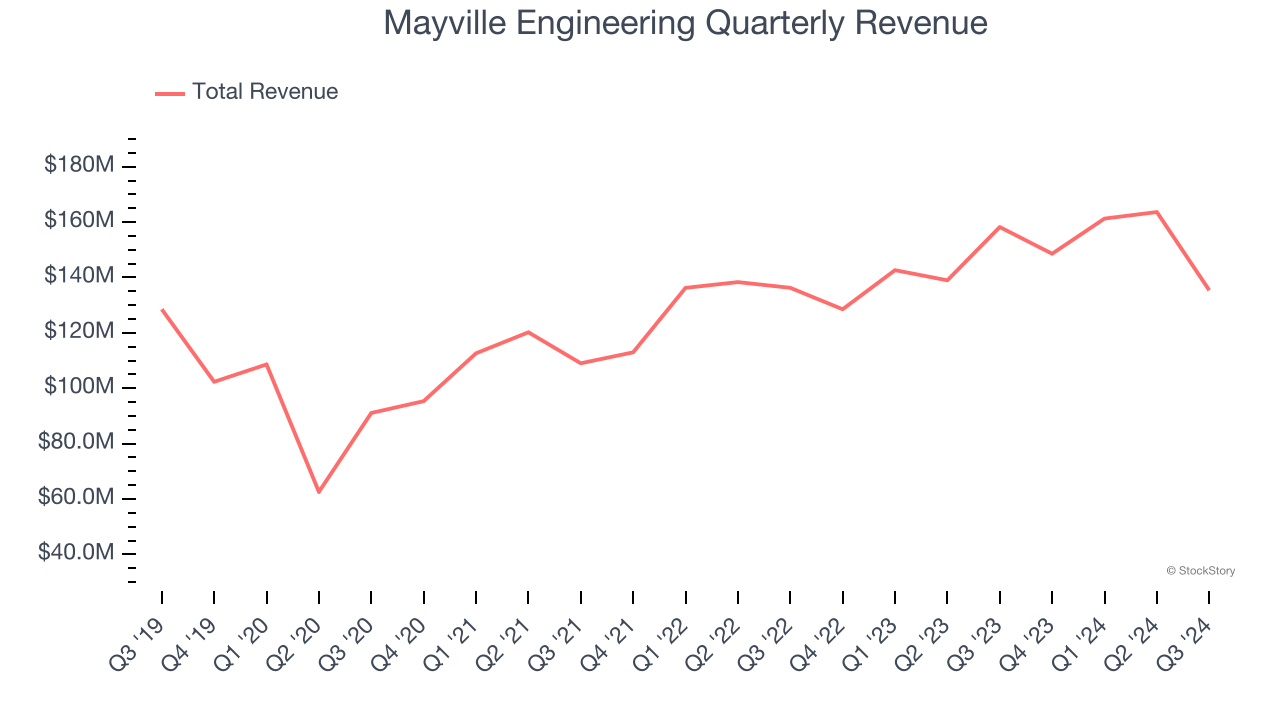
2. Low Gross Margin Reveals Weak Structural Profitability
For industrials businesses, cost of sales is usually comprised of the direct labor, raw materials, and supplies needed to offer a product or service. These costs can be impacted by inflation and supply chain dynamics in the short term and a company’s purchasing power and scale over the long term.
Mayville Engineering has bad unit economics for an industrials business, signaling it operates in a competitive market. As you can see below, it averaged a 12.3% gross margin over the last five years. Said differently, Mayville Engineering had to pay a chunky $87.69 to its suppliers for every $100 in revenue. 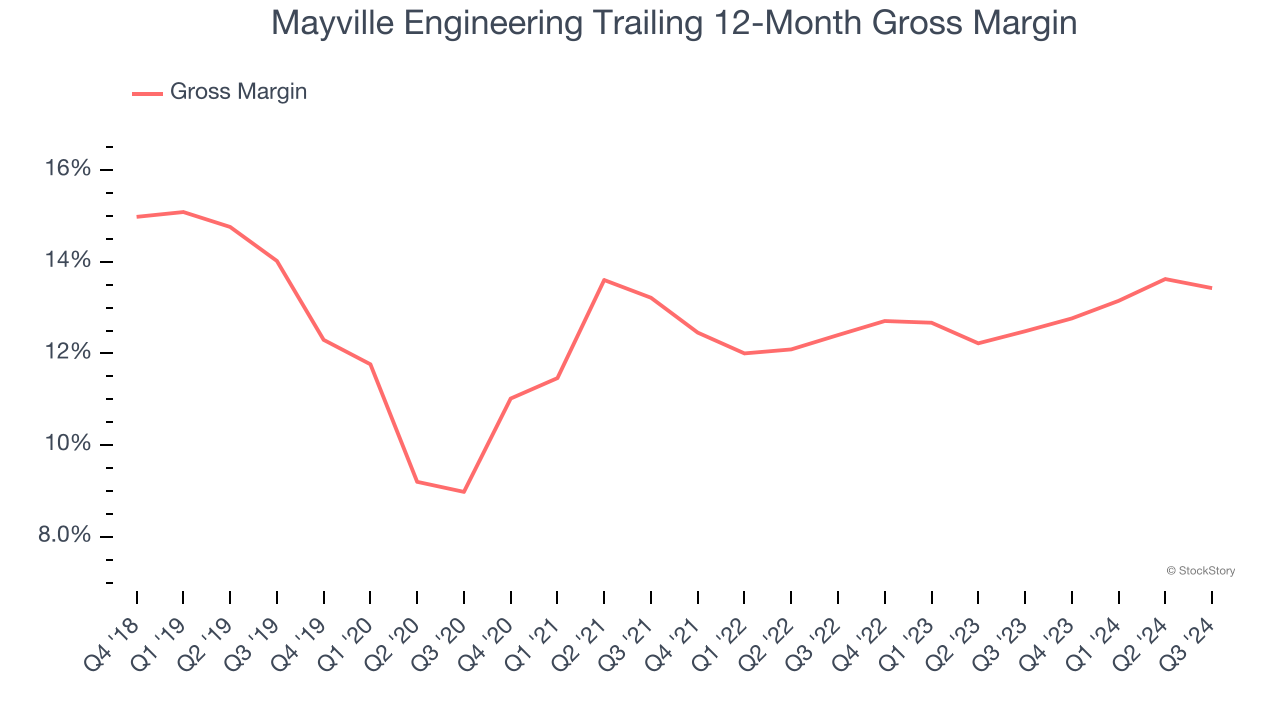
3. EPS Trending Down
We track the long-term change in earnings per share (EPS) because it highlights whether a company’s growth is profitable.
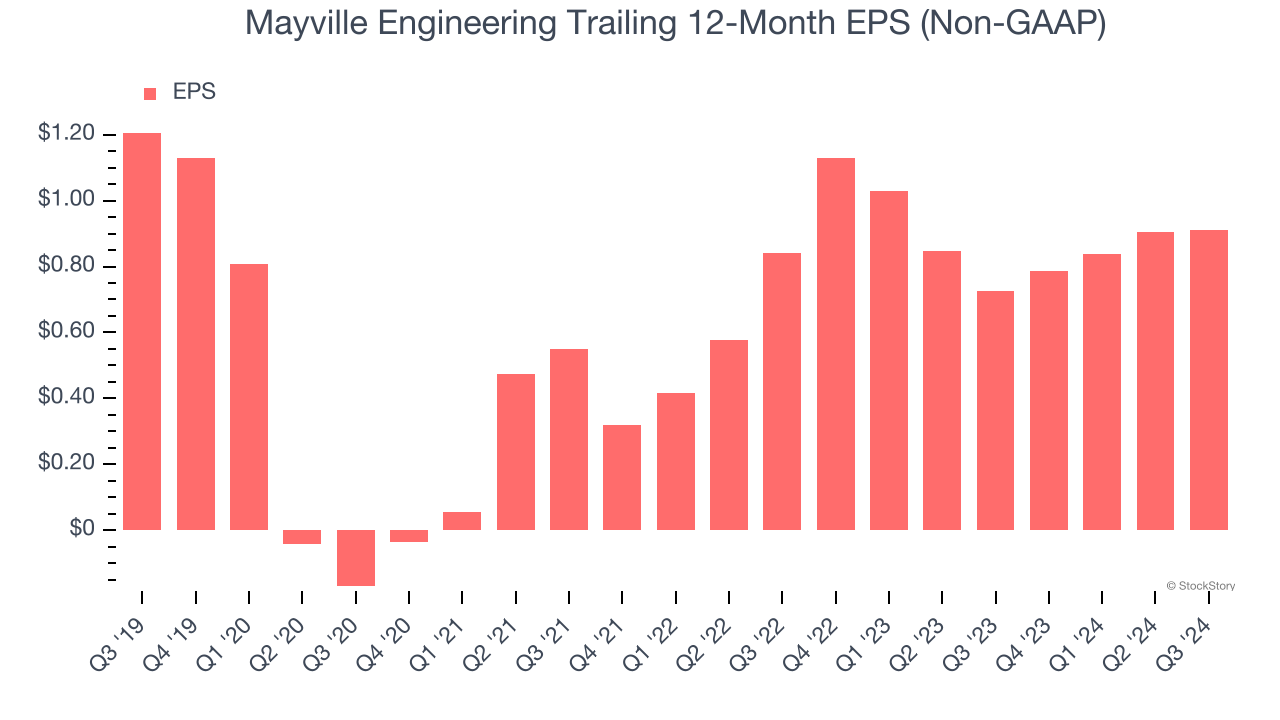
Sadly for Mayville Engineering, its EPS declined by 5.4% annually over the last five years while its revenue grew by 3.7%. This tells us the company became less profitable on a per-share basis as it expanded.
Final Judgment
Mayville Engineering isn’t a terrible business, but it doesn’t pass our quality test. With its shares lagging the market recently, the stock trades at 12.2× forward price-to-earnings (or $15.72 per share). This valuation multiple is fair, but we don’t have much faith in the company. We're fairly confident there are better stocks to buy right now. Let us point you toward Chipotle, which surprisingly still has a long runway for growth.
Stocks We Like More Than Mayville Engineering
With rates dropping, inflation stabilizing, and the elections in the rearview mirror, all signs point to the start of a new bull run - and we’re laser-focused on finding the best stocks for this upcoming cycle.
Put yourself in the driver’s seat by checking out our Top 5 Strong Momentum Stocks for this week. This is a curated list of our High Quality stocks that have generated a market-beating return of 175% over the last five years.
Stocks that made our list in 2019 include now familiar names such as Nvidia (+2,691% between September 2019 and September 2024) as well as under-the-radar businesses like Comfort Systems (+783% five-year return). Find your next big winner with StockStory today for free.