Yum! Brands currently trades at $134.16 per share and has shown little upside over the past six months, posting a middling return of 3.2%. This is close to the S&P 500’s 7.3% gain during that period.
Given the underwhelming price action, is now a good time to buy YUM? Or should investors expect a bumpy road ahead? Find out in our full research report, it’s free.
Why Is Yum! Brands a Good Business?
Spun off as an independent company from PepsiCo, Yum! Brands (NYSE: YUM) is a multinational corporation that owns KFC, Pizza Hut, Taco Bell, and The Habit Burger Grill.
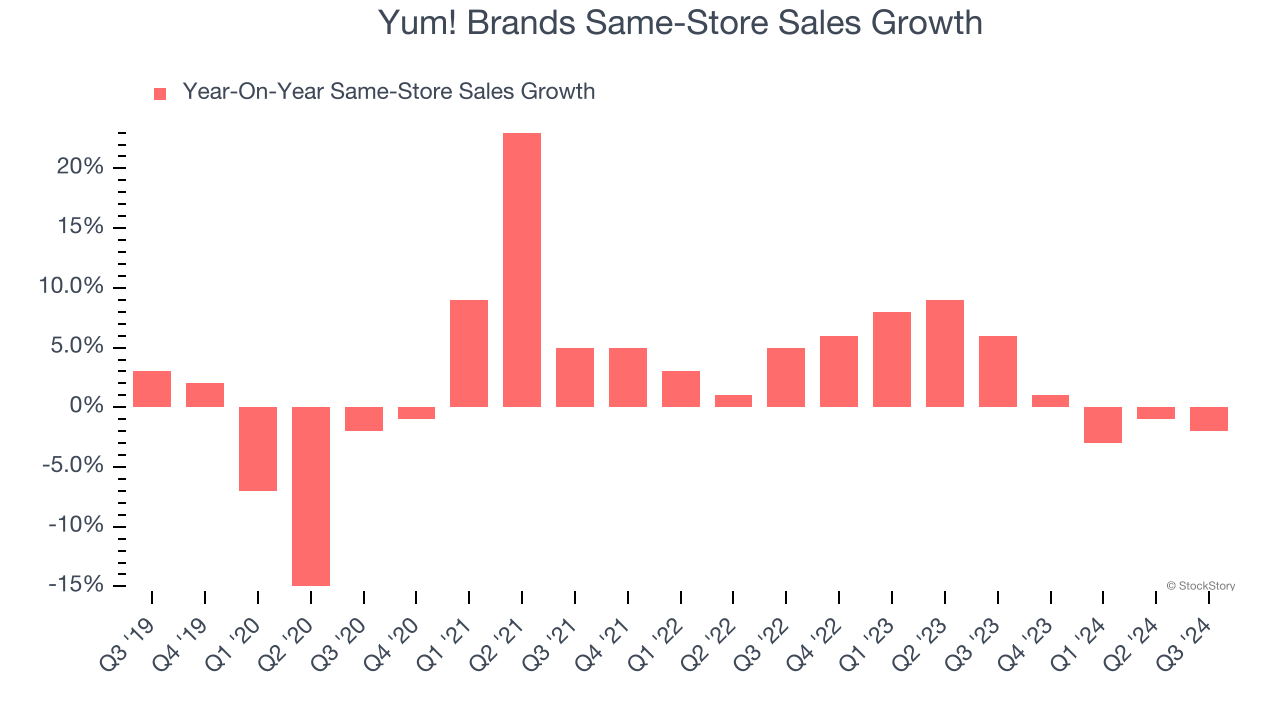
1. Solid Same-Store Sales Suggest Increasing Demand
Same-store sales is a key performance indicator used to measure organic growth at restaurants open for at least a year.
Yum! Brands’s demand has been healthy for a restaurant chain over the last two years. On average, the company has grown its same-store sales by a robust 3% per year.
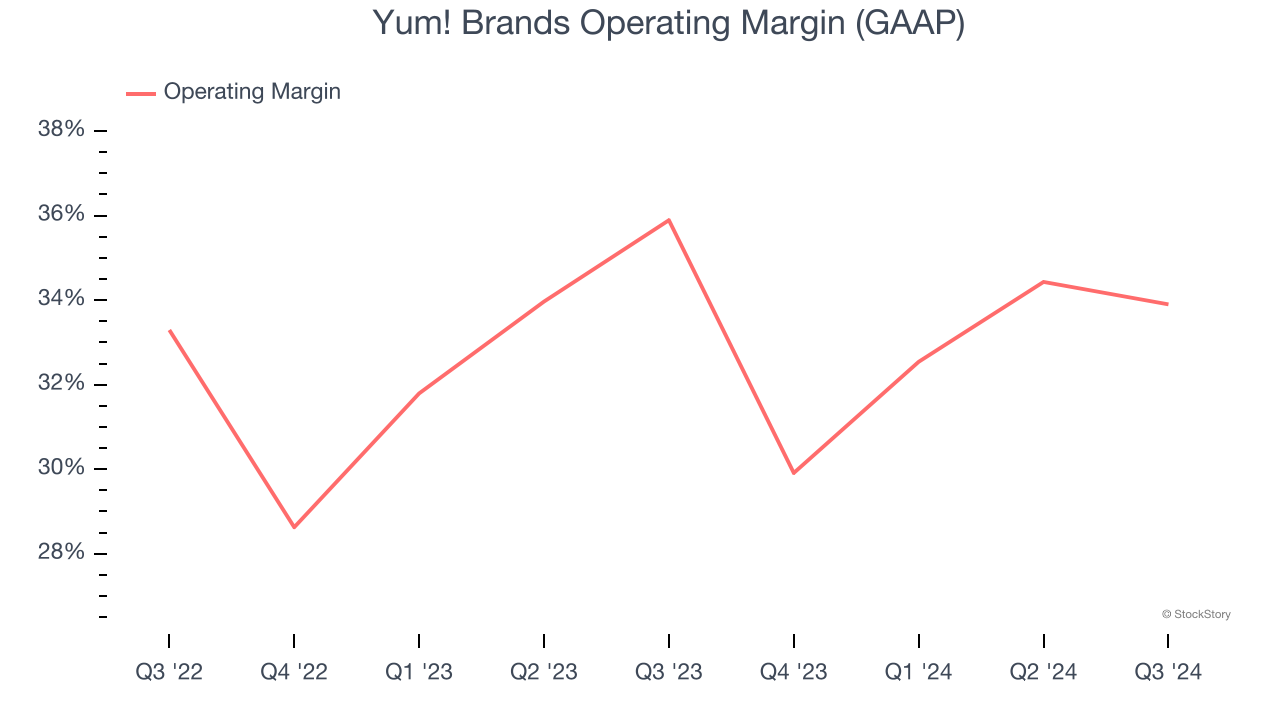
2. Operating Margin Reveals a Well-Run Organization
Operating margin is an important measure of profitability for restaurants as it accounts for all expenses keeping the lights on, including wages, rent, advertising, and other administrative costs.
Yum! Brands has been a well-oiled machine over the last two years. It demonstrated elite profitability for a restaurant business, boasting an average operating margin of 32.5%. This result isn’t surprising as its high gross margin gives it a favorable starting point.
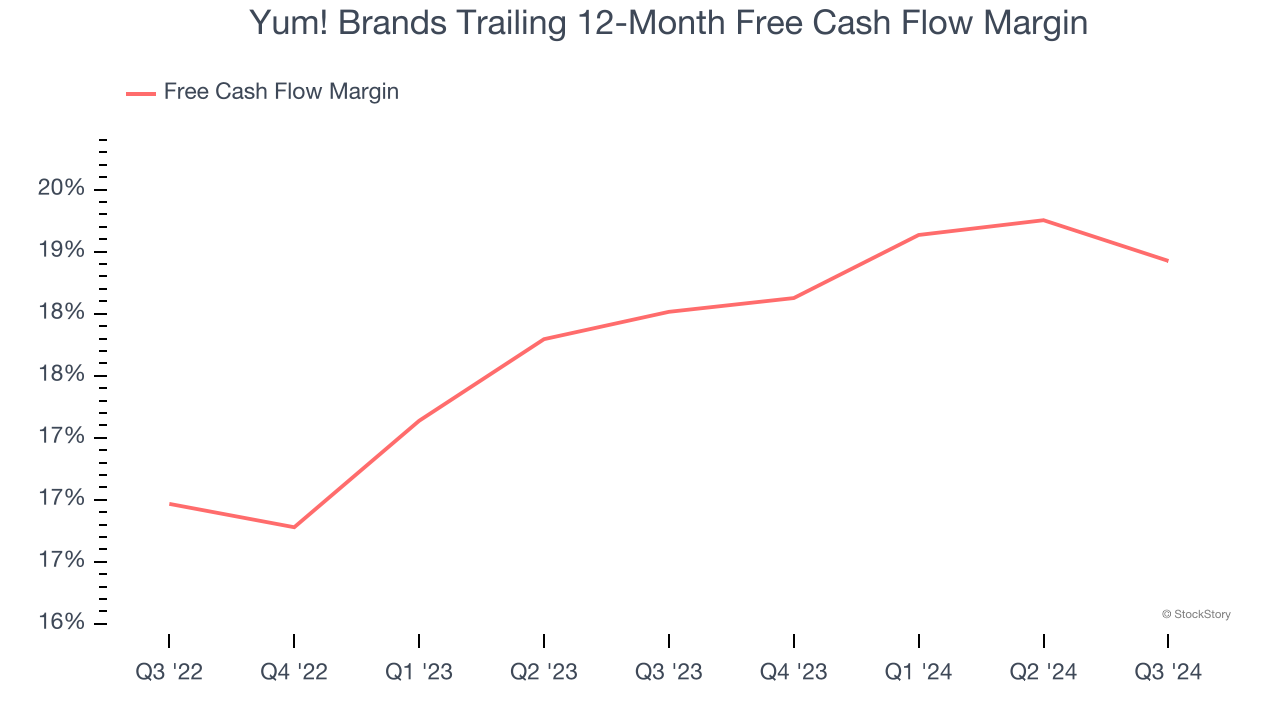
3. Excellent Free Cash Flow Margin Boosts Reinvestment Potential
If you’ve followed StockStory for a while, you know we emphasize free cash flow. Why, you ask? We believe that in the end, cash is king, and you can’t use accounting profits to pay the bills.
Yum! Brands has shown terrific cash profitability, driven by its lucrative business model that enables it to reinvest, return capital to investors, and stay ahead of the competition. The company’s free cash flow margin was among the best in the restaurant sector, averaging 18.7% over the last two years.
Final Judgment
These are just a few reasons why Yum! Brands ranks highly on our list, but at $134.16 per share (or 21.8× forward price-to-earnings), is now the time to initiate a position? See for yourself in our comprehensive research report, it’s free.
Stocks We Like Even More Than Yum! Brands
The elections are now behind us. With rates dropping and inflation cooling, many analysts expect a breakout market to cap off the year - and we’re zeroing in on the stocks that could benefit immensely.
Take advantage of the rebound by checking out our Top 5 Strong Momentum Stocks for this week. This is a curated list of our High Quality stocks that have generated a market-beating return of 175% over the last five years.
Stocks that made our list in 2019 include now familiar names such as Nvidia (+2,691% between September 2019 and September 2024) as well as under-the-radar businesses like Comfort Systems (+783% five-year return). Find your next big winner with StockStory today for free.