Over the past six months, Sphere Entertainment’s stock price fell to $41.39. Shareholders have lost 7.7% of their capital, which is disappointing considering the S&P 500 has climbed by 8%. This might have investors contemplating their next move.
Is there a buying opportunity in Sphere Entertainment, or does it present a risk to your portfolio? Get the full breakdown from our expert analysts, it’s free.
Despite the more favorable entry price, we're swiping left on Sphere Entertainment for now. Here are three reasons why we avoid SPHR and a stock we'd rather own.
Why Do We Think Sphere Entertainment Will Underperform?
Famous for its viral Las Vegas Sphere venue, Sphere Entertainment (NYSE: SPHR) hosts live entertainment events and distributes content across various media platforms.
1. Long-Term Revenue Growth Disappoints
A company’s long-term performance is an indicator of its overall quality. While any business can experience short-term success, top-performing ones enjoy sustained growth for years. Over the last five years, Sphere Entertainment grew its sales at a sluggish 4% compounded annual growth rate. This fell short of our benchmark for the consumer discretionary sector. 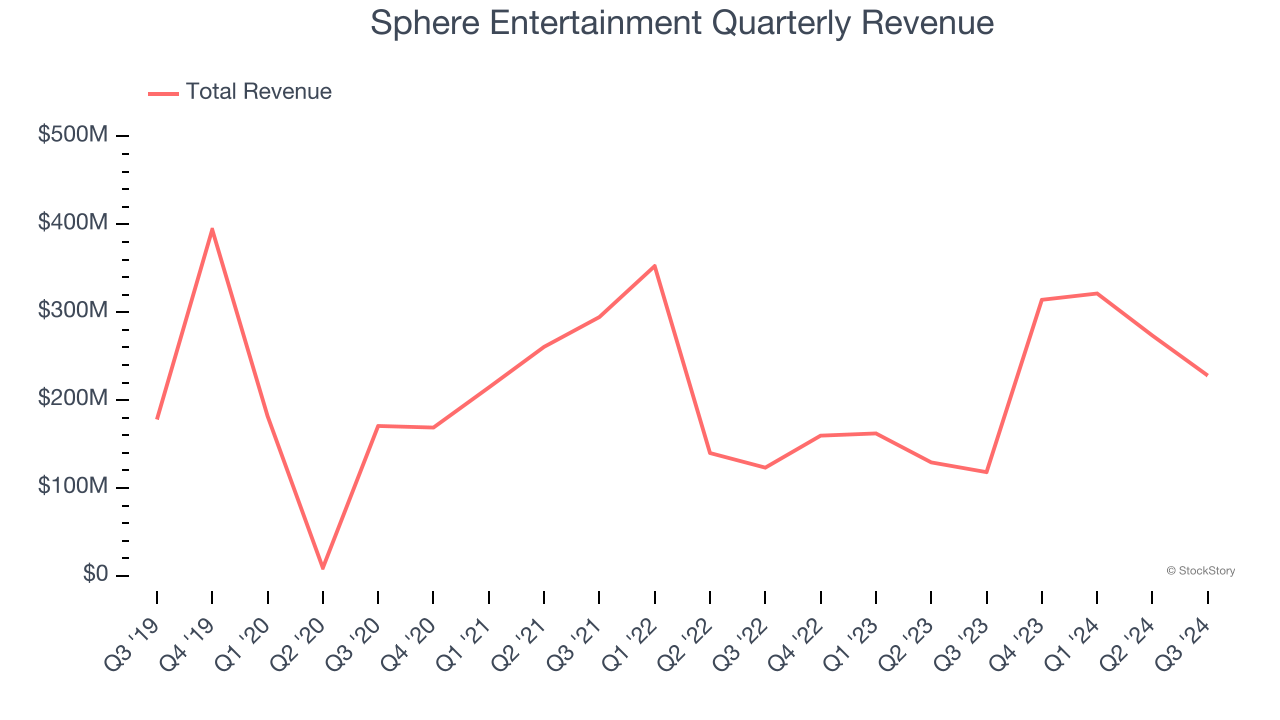
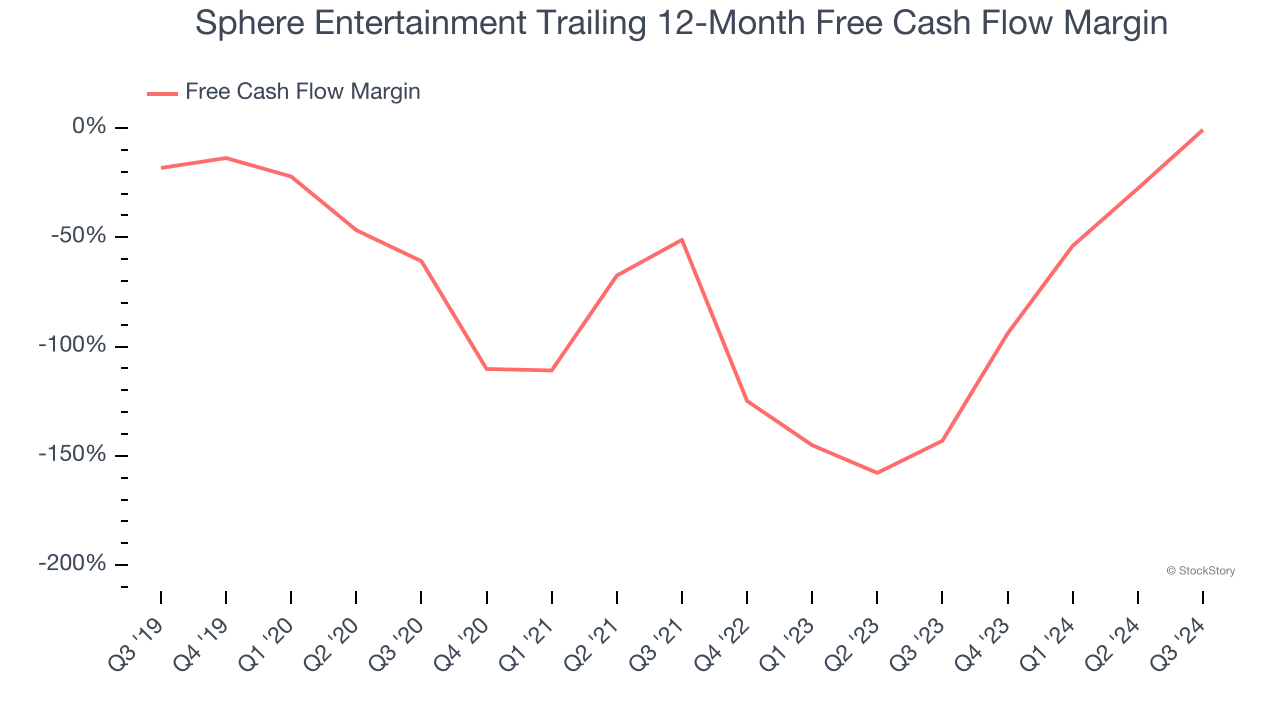
2. Cash Burn Ignites Concerns
Free cash flow isn't a prominently featured metric in company financials and earnings releases, but we think it's telling because it accounts for all operating and capital expenses, making it tough to manipulate. Cash is king.
While Sphere Entertainment posted positive free cash flow this quarter, the broader story hasn’t been so clean. Over the last two years, Sphere Entertainment’s demanding reinvestments to stay relevant have drained its resources, putting it in a pinch and limiting its ability to return capital to investors. Its free cash flow margin averaged negative 48.2%, meaning it lit $48.25 of cash on fire for every $100 in revenue.
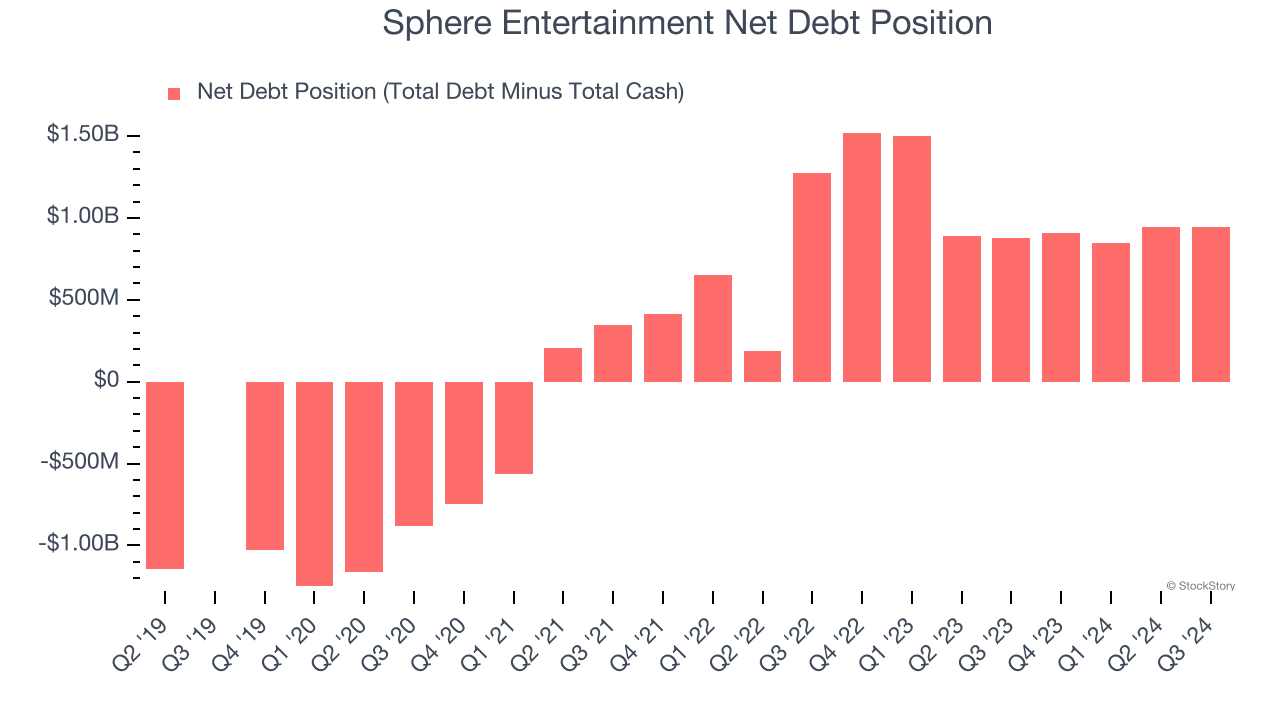
3. Short Cash Runway Exposes Shareholders to Potential Dilution
As long-term investors, the risk we care about most is the permanent loss of capital, which can happen when a company goes bankrupt or raises money from a disadvantaged position. This is separate from short-term stock price volatility, something we are much less bothered by.
Sphere Entertainment burned through $9.20 million of cash over the last year, and its $1.50 billion of debt exceeds the $553.2 million of cash on its balance sheet. This is a deal breaker for us because indebted loss-making companies spell trouble.
Unless the Sphere Entertainment’s fundamentals change quickly, it might find itself in a position where it must raise capital from investors to continue operating. Whether that would be favorable is unclear because dilution is a headwind for shareholder returns.
We remain cautious of Sphere Entertainment until it generates consistent free cash flow or any of its announced financing plans materialize on its balance sheet.
Final Judgment
We cheer for all companies serving everyday consumers, but in the case of Sphere Entertainment, we’ll be cheering from the sidelines. Following the recent decline, the stock trades at 14.2× forward EV-to-EBITDA (or $41.39 per share). This valuation tells us a lot of optimism is priced in - we think there are better stocks to buy right now. We’d recommend looking at Google, whose cloud computing and YouTube divisions are firing on all cylinders.
Stocks We Like More Than Sphere Entertainment
The Trump trade may have passed, but rates are still dropping and inflation is still cooling. Opportunities are ripe for those ready to act - and we’re here to help you pick them.
Get started by checking out our Top 5 Growth Stocks for this month. This is a curated list of our High Quality stocks that have generated a market-beating return of 175% over the last five years.
Stocks that made our list in 2019 include now familiar names such as Nvidia (+2,183% between December 2019 and December 2024) as well as under-the-radar businesses like Comfort Systems (+751% five-year return). Find your next big winner with StockStory today for free.